9123 views
owned this note
OpenStreetMap Resources for Web Developers
===
**Programming resources from lowcode - like adding a location plan to your website or create a web map with POIs without own server - up to simple scripting with HTML, CSS and Javascript**
_Authors: Stefan Keller, OST/SOSM ([contact](https://sosm.ch/de/kontakt/)), with awesome help from Ciro Brodmann, Markus Peloso and others. Updated February 2024. Document license CC0 1.0._
# Overview
This document provides web developers as well as front-end and software engineers with a quick start with OpenStreetMap resources. It focuses on client side web applications - i.e., web apps without a custom backend - and it's slightly Swiss biased. Main use cases are:
* **Use Case 1**: Adding a location plan (avenue) of your business to your website (**'Location Plan'**)
* **Use Case 2a**: Creating an interactive web map with some POIs (**'POI Map'**).
* **Use Case 2b**: Creating an interactive web map with many POIs (**'POI Map with GeoJSON'**).
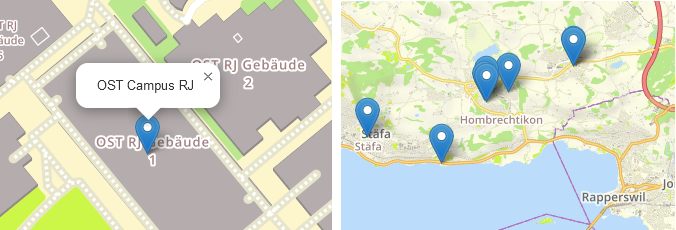
_Figure 1: Left: Location Plan of OST-Campus RJ. Right: POI Map showing table tennis tables around Hombrechtikon._
This document isn't a tutorial, but it gives examples, blueprints and links. It suits people with beginner or intermediate knowledge of HTML and CSS and a little knowledge of JavaScript.
:::info
**Looking for adding a map with JavaScript programming**? See e.g. this [Collection of plugins for using D3.js with Leaflet]( https://github.com/bluehalo/leaflet-d3).
:::
Those who already know OpenStreetMap and Geographic Information Systems (GIS) can skip the next chapter "About OpenStreetMap (OSM) and Geographic Information Systems".
Quickly jump to examples or demo projects using the table below:
| | Location Plan | POI Map | Programming |
|--------------------|:--------------------------------------------:|:-----------------------------------------------:|---------------------|
| **OSM Standard** | [View example ↓](#…-using-a-HTML-ltiframegt) | Not possible! | HTML |
| **uMap** | [View example ↓](#…-using-a-HTML-ltiframegt) | [View example ↓](#…-using-uMap-web-application) | HTML |
| **JS Leaflet** | [View demo project ↓](#…-and-Leaflet) | [View demo project ↓](#…-and-Leaflet1) | JavaScript |
| **JS OpenLayers** | [View demo project ↓](#…-and-OpenLayers) | [View demo project ↓](#…-and-OpenLayers1) | JavaScript |
| **JS Vue-Leaflet** | [View demo project ↓](#…-and-Vue-Leaflet) | [View demo project ↓](#…-and-Vue-Leaflet1) | JavaScript, VueJS |
| **Wordpress** | [View demo project ↓](#…-using-WordPress) | [View demo project ↓](#…-using-WordPress1) | Wordpress Shortcode |
_Table: Location plan and POI map and its implementation examples._
:::info
***What is Leaflet and OpenLayers?*** Both are JavaScript libraries for interactive maps where developers can easily access third-party base maps and user-defined map source, like GeoJSON or web maps services. Both are open-source and mobile-friendly. There are other alternatives but [Leaflet](https://leafletjs.com/) is the most well known.
:::
:::info
***What is GeoJSON?*** GeoJSON is an open standard format for representing simple geographic features along with their non-spatial attributes. It is based on the JSON format and adds the geometry attribute types of points (coordinates), lines, and areas (polygons). Coordinates are latitude/longitude. Most geospatial applications and libraries (such as Leaflet and OpenLayers) support GeoJSON files. See for example [Wikipedia](https://en.wikipedia.org/wiki/GeoJSON) for more information.
:::
# About OpenStreetMap (OSM) and Geographic Information Systems (GIS)
**OpenStreetMap (OSM)** is the Wikipedia of maps: www.openstreetmap.org (www.osm.org). It is the largest crowdsourced citizen science spatial (vector) data project in the world. In recent years, OSM has become the best alternative to Google Maps in many ways, such as route planning and all this while preserving privacy. And it is a goldmine of 1001 points-of-interest (POI); see e.g. this article on the [Nutzen von OpenStreetMap im Tourismus](https://md.coredump.ch/s/r1BpwhVO8#) (in german).
For learning about concepts of OSM, and tools (like iD Editor, tagfinder, taginfo) see [OpenSchoolMaps](https://openschoolmaps.ch/pages/materialien.html#openstreetmap-bearbeiten-und-nutzen) or [LearnOSM](https://learnosm.org/). And of course we assume you already have edited OpenStreetMap yourself: Just register at OSM.org and klick on "Edit"; then an online tour of using the iD Editor will start.
The domain of **Geographic Information Systems (GIS)** contains spatial data visualization and interactive web mapping. These are some basics about interactive web maps:
* A typical interactive web map with POIs (or marker/icon) consists of several graphical window interface elements, like webpage header (vs. 'map canvas'), buttons, input fields and layers: See figure 1.
* Navigation on the map intuitively is done with mouse moves, plus with buttons "Zoom in" and "Zoom out" (defining zoom levels).
* The "Base Map Layer" gives you background information where you are. The optional "Layer Switch" button typically lets you choose which base map is being displayed in the background: topographic map (default) or satellite map.
* The "Base Map Layer" is visually overlayed by a marker (pin / icon / pictogram) - or one or several "POI Layers" (in figure 1 one there's one castle layer with point icons).
* An optional "Share" button lets you share the current map view with others or in your posts. Here's an [example](https://www.openstreetmap.org/?mlat=47.22333&mlon=8.81756#map=17/47.22333/8.81756).

_Figure 2: Sketch showing the graphical elements of an interactive web map._
For those not familiar with OSM and GIS tools, see the chapter at the bottom.
:::info
**Usage policy and copyright**: Note the usage policies of OSM services. Make sure to add this copyright to your map: "© [OpenStreetMap](https://openstreetmap.org/copyright) contributors". Typically, you also add "[Fix an error](https://www.openstreetmap.org/fixthemap?lat=47.2242&lon=8.8227&zoom=15)" (see the weblinks behind).
:::
# Location Plan (Use Case 1)
With these informations you'll be able to add a simple map with a marker to a website.
## ... using a HTML \<iframe\>
You can add a map with a marker to a website with no coding by embedding it with HTML \<iframe\> tag. For doing this simply ...
1. start OSM.org,
2. center on your location,
3. klick on the "Share" button in OSM.org (see figure 2),
4. and paste the HTML to your website (see figure 3).

_Figure 3: Getting HTML \<iframe\> snippet from OSM.org. (Source: Own screenshot)_
<iframe width="400" height="200" frameborder="0" scrolling="no" marginheight="0" marginwidth="0" src="https://www.openstreetmap.org/export/embed.html?bbox=8.81254%2C47.22084%2C8.822579%2C47.22583&layer=mapnik&marker=47.22333%2C8.817558" style="border: 1px solid black"></iframe><br/><small><a href="https://www.openstreetmap.org/?mlat=47.22333&mlon=8.81756#map=17/47.22333/8.81756">⛶ View Larger Map</a></small>
_Figure 4 (👆interactive on the web!): Web map with uMap showing OST Campus Rapperswil (Switzerland)._
## ... using JavaScript
You can also add a map with a marker (or multiple markers) using HTML/CSS and JavaScript programming. This is an example of a website containing a map with a single marker: [Location map for Bitwäscherei Zürich](https://www.digitale-gesellschaft.ch/uber-uns/bitwaescherei). See "OSM-based Frontend Map Libraries" below for map libraries like Leaflet.
### ... and Leaflet
You can find an example project creating a map with a marker and accompanying label below. Dragging the divider on the left reveals the source code.
Leaflet is fairly straightforward and does not need a lot of setup to display a map with a marker. The code is also rather self-explanatory.
There are a few parts, though, that we would like to highlight:
* `map.attributionControl.setPrefix(false);` removes the Leaflet attribution in the bottom right-hand corner.
* Feel free to drop `.openPopup()`. It is only used to initially open the popup.
* `map.on("move", ...);` does not get called when the map is initially loaded. In our example this means we have to insert proper lat/lon/zoom values into the 'Report a problem' when constructing it.
<iframe src="https://codesandbox.io/embed/leaflet-marker-forked-7glujj?fontsize=14&hidenavigation=1&theme=dark&module=/src/index.js,/index.html,/src/styles.css"
style="width:100%; height:600px; border:0; border-radius: 4px; overflow:hidden;"
title="leaflet-marker"
allow="accelerometer; ambient-light-sensor; camera; encrypted-media; geolocation; gyroscope; hid; microphone; midi; payment; usb; vr; xr-spatial-tracking"
sandbox="allow-forms allow-modals allow-popups allow-presentation allow-same-origin allow-scripts">
</iframe>
_Figure 5 (👆interactive on the web!): Demo Location Plan project using leaflet in CodeSandbox._
You may want to add more than one marker, perhaps because you want to mark multiple buildings in your location plan. You can do so by adding one or two extra lines of code per marker, depending on whether you want a popup text. Here's an example:
```JavaScript
let marker1 = new L.marker([47.22334, 8.81752]).addTo(map);
marker1.bindPopup("OST Campus RJ - Building 1"); // if you want a popup text
```
Repeat this step for each marker. Keep in mind to set the correct coordinates.
Depending on the position of your markers, you may need to use different centre coordinates to nicely fit all markers. You can set the centre coordinates in this line of code:
```JavaScript
let map = L.map("map").setView(mapCentreCoords, zoom);
// e.g. mapCentreCoords = [47.22331, 8.81752]
```
Here's an interactive example using OST's Rapperswil campus. You'll notice it's essentially the same as the previous example, but with more marker objects in code:
<iframe src="https://codesandbox.io/embed/225r2h?fontsize=14&hidenavigation=1&theme=dark&module=/src/index.js,/index.html,/src/styles.css"
style="width:100%; height:600px; border:0; border-radius: 4px; overflow:hidden;"
title="leaflet-markers"
allow="accelerometer; ambient-light-sensor; camera; encrypted-media; geolocation; gyroscope; hid; microphone; midi; payment; usb; vr; xr-spatial-tracking"
sandbox="allow-forms allow-modals allow-popups allow-presentation allow-same-origin allow-scripts"
></iframe>
_Figure 6 (👆interactive on the web!): Demo Location Plan with many markers using Leaflet_
### ... and OpenLayers
Compared to Leaflet, OpenLayers requires more code to set up such a map. It also does less for you by default. For example, you have to define an icon for the marker yourself (we copied over the marker from leaflet, so that it looks similar), otherwise it just inserts a circle at the designated coordinates. However, it is more flexible with coordinate transformations.
There's another demo project below. Dragging the divider reveals the code, as above.
A few things to note:
* Coordinates are generally entered as 'lon, lat' instead of 'lat, lon'
* Popups require code to open and close, they also have to be added to the html file and styles are not included by default and have to be set manually.
* By default, icons are centred at their location. If your icon is a marker - like in this example - you have to define an offset so that the pointy bottom part gets put at the point's coordinates. `anchor: [0.5, 1]` works well for this icon. `0.5` centres it on the horizontal axis and `1` moves the icon upwards so that the bottom is aligned with the coordinates.
* `map.on("moveend", ...);` also gets called when the map is initially built. In our case this means that, unlike with leaflet, we do not have to insert proper initial values for lat/lon/zoom into the 'Report a problem' link.
* The map internally uses EPSG:3857. To convert coordinates to EPSG:4326, use ```ol.proj.transform(
your_data_source,
"EPSG:3857",
"EPSG:4326"
);```
<iframe src="https://codesandbox.io/embed/openlayers-marker-forked-peuqtg?fontsize=14&hidenavigation=1&theme=dark&module=/src/index.js,/index.html,/src/styles.css"
style="width:100%; height:600px; border:0; border-radius: 4px; overflow:hidden;"
title="leaflet-marker"
allow="accelerometer; ambient-light-sensor; camera; encrypted-media; geolocation; gyroscope; hid; microphone; midi; payment; usb; vr; xr-spatial-tracking"
sandbox="allow-forms allow-modals allow-popups allow-presentation allow-same-origin allow-scripts"
></iframe>
_Figure 7 (👆interactive on the web!): Demo Location Plan project using OpenLayers in CodeSandbox._
You may want to add more than one marker, perhaps because you want to mark multiple buildings in your location plan. However, this means that we have to adjust a couple lines of code. Here are the changes – line numbers refer to the adjusted interactive project below:
1. We need to adjust how we save the coordinates (and the popup label contents): We will create a list with objects containing the necessary information:
```javascript=10
const markers = [
{
coords: [8.81752, 47.22334],
label: "OST Campus RJ – Building 1",
},
// .. any additional markers
]
```
You can omit the label property if you do not require it.
2. You may need to set a separate centre point for the map, so that all markers are still visible. You can set it in the map object in its `view` property:
```javascript=61
// ...
view: new View({
zoom: zoom,
center: mapCentreCoords, // e.g. mapCentreCoords = [8.81752, 47.22334]
maxZoom: 21,
}),
// ...
```
Note that you can also use the coordinates of one of the points if that works best (like in our example below).
3. We will need to adjust the `createMarker` function so that it places all features on the map. You can do that using a list map function:
```javascript=74
function createMarker() {
const features = markers.map(
(marker) =>
new Feature({
geometry: new Point(fromLonLat(marker.coords)), // set the coordinates
label: marker.label, // add the label to the OL feature object
})
);
// ...
```
You may omit the label assignment if you do not require it.
We then change our `VectorSource` to include these markers:
```javascript=83
const vectorSource = new VectorSource({
features: features,
});
// ...
}
```
4. Remove or comment out the code used for opening the popup when the map loads:
```javascript=115
// content.innerHTML = "OST Campus RJ – Building 1";
// overlay.setPosition(fromLonLat(markers[0].coords));
```
5. (Only in case you want to use label popups): Then we are going to adjust the click function, so that the popup displays the correct text. We get to the marker feature using `map.forEachFeatureAtPixel` and access the label's value with `feature.values_.label`:
```javascript=124
map.on("singleclick", function (event) {
if (map.hasFeatureAtPixel(event.pixel) === true) {
const coordinate = event.coordinate;
let labelContent = "";
map.forEachFeatureAtPixel(event.pixel, (feature) => {
labelContent = feature.values_.label;
});
content.innerHTML = labelContent;
overlay.setPosition(coordinate);
} else {
overlay.setPosition(undefined);
closer.blur();
}
});
```
6. (Popup only): Change the offset of the popup, so that it appears on the tip of the mouse pointer:
```javascript=104
const overlay = new Overlay({
element: container,
autoPan: true,
autoPanAnimation: {
duration: 250,
},
offset: [0, -1], // offset in pixels, [horizontal, vertical]
// ^ set this offset value
});
```
Have a look at this interactive example project using OST's Rapperswil campus:
<iframe src="https://codesandbox.io/embed/pnh3dz?fontsize=14&hidenavigation=1&theme=dark&module=/src/index.js,/index.html,/src/styles.css"
style="width:100%; height: 600px; border:0; border-radius: 4px; overflow:hidden;"
title="openlayers-markers"
allow="accelerometer; ambient-light-sensor; camera; encrypted-media; geolocation; gyroscope; hid; microphone; midi; payment; usb; vr; xr-spatial-tracking"
sandbox="allow-forms allow-modals allow-popups allow-presentation allow-same-origin allow-scripts"
></iframe>
_Figure 8 (👆interactive on the web!): Demo Location Plan with many markers using OpenLayers_
### ... and Vue-Leaflet
Below you can find some example code that shows how a map with a marker can be implemented using Vue and [Vue-Leaflet](https://github.com/vue-leaflet/vue-leaflet).
Please note that Vue-Leaflet is still in beta. Hence, some functionality might not work or might be missing entirely. When creating the demo project below, we noticed that:
* adding map boundaries (to prevent the user from moving the map too much) is not currently possible / working
* having a popup show up from the marker after loading the page is not
* the transition between zoom levels is - unlike with regular leaflet - not animated at all.
There are a few things we think are important to note:
* `{attributionControl: false}` removes the leaflet attribution that gets inserted by default. If you want your attribution to fit nicely in the bottom right corner, this needs to be set to false, as this plugin doesn't combine both attributions and displays one above the other.
* By default, l-map's css `height` and `width` attributes are set to 100% inline. To use custom dimensions, override these values with `!important`.
* In order for the map to display correctly, import the css inside the `<script>` tag either in the component where you use `<l-map>` or any parent component.
```vue=
<template>
<l-map
ref="map"
v-model:zoom="zoom"
v-model:center="center"
:options="{attributionControl: false}">
<l-tile-layer
url="https://tile.osm.ch/osm-swiss-style/{z}/{x}/{y}.png"
layer-type="base"
name="Swiss Style OSM"
></l-tile-layer>
<l-marker :lat-lng="markerPos">
<l-popup> <!--having it open automatically
does not seem to be possible with this version of vue-leaflet-->
OST Campus RJ
</l-popup>
</l-marker>
<l-control-attribution
position="bottomright"
:prefix="attribution"
></l-control-attribution>
</l-map>
</template>
<script>
import "leaflet/dist/leaflet.css";
import {LControlAttribution,
LMap,
LMarker,
LPopup,
LTileLayer
} from "@vue-leaflet/vue-leaflet";
export default {
name: "MapComponent",
components: {
LMap,
LTileLayer,
LMarker,
LPopup,
LControlAttribution
},
data() {
return {
zoom: 18,
geojson: null,
markerPos: [47.22331, 8.81752],
center: [47.22331, 8.81752],
attribution: "Data © " +
"<a href='https://openstreetmap.org/copyright'>" +
"OpenStreetMap</a> " +
"contributors " +
"<a href='https://opendatacommons.org/licenses/odbl/'>ODbL</a>" +
" | Map by <a href='https://sosm.ch/'>SOSM</a> | " +
"<a id='problem-attribution' " +
"href='https://www.openstreetmap.org/fixthemap?" +
"lat=47.41330&lon=8.65639&zoom=18'>Report a problem</a>",
};
},
watch: {
zoom() {
this.updateProblemLink();
},
center() {
this.updateProblemLink();
}
},
methods: {
updateProblemLink() {
this.$el.querySelector("#problem-attribution")
.href = "https://www.openstreetmap.org/fixthemap?" +
`lat=${this.center.lat}&lon=${this.center.lng}` +
`&zoom=${this.zoom}`;
}
},
}
</script>
<style scoped>
</style>
```
_Listing 1: Example code for a Location Plan using Vue Leaflet_
Due to technical constraints in CodeSandbox, this project is not available there. To view this example in a browser, click [here](https://geometalab.gitlab.io/web-map-demos/vue-marker-demo/). The complete project can be found [here](https://gitlab.com/geometalab/web-map-demos/vue-geojson-demo).
**In order to use multiple markers** rather than just one, we will need to adjust our code. Line numbers (specifically the first in a code block) reference the location where the change is necessary in the original single-marker vue project above. Here are the changes:
1. Change the markers: create a list of objects containing the information for the markers:
```vue=45
data() {
return {
zoom: 18,
geojson: null,
markers: [ // <– change this property
{
coords: [47.22331, 8.81752],
label: "OST Campus RJ – Building 1",
},
{
coords: [47.22361, 8.81809],
label: "OST Campus RJ – Building 2",
}
// Add more markers as needed
],
// ...
};
```
You can omit the label property in the objects if you do not wish to add them.
2. Adjust the element in the vue template using `v-for`:
```vue=12
<l-marker :key="index" v-for="(marker, index) in markers" :lat-lng="marker.coords">
<l-popup>
{{ marker.label }}
</l-popup>
</l-marker>
```
You can find the code for the working project with multiple markers on the `multiple_markers` [branch](https://gitlab.com/geometalab/web-map-demos/vue-marker-demo/-/tree/multiple_markers?ref_type=heads) on GitLab.
## ...using WordPress
If you are using WordPress, you can use the [Leaflet Map](https://wordpress.org/plugins/leaflet-map/) plugin to add a location plan to your website. The plugin is free and open-source. The GitHub repository can be found at [github.com/bozdoz/wp-plugin-leaflet-map](https://github.com/bozdoz/wp-plugin-leaflet-map#available-shortcodes).
### Shortcode Helper
If you want to create a map with a marker without writing a "shortcode" (i.e. a template/variable) yourself, you can use the shortcode helper found in your WordPress instance in the sidebar.
In the shortcode helper you can drag and zoom the map and set the marker to where you want and then copy the generated shortcode below the map into any WordPress page or post.
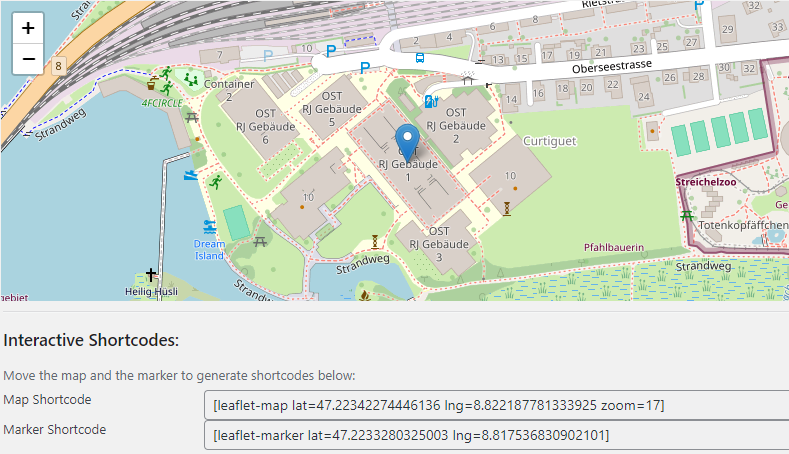
_Figure 9: WordPress Leaflet Plugin Shortcode Helper_
### Creating a Location Map with Leaflet Map Plugin
Use the shortcode helper, which comes with the Leaflet Map plugin, to generate shortcode or you can create a map with `[leaflet-map]` in a shortcode block on any page or post. The `[leaflet-map]` shortcode has many options, see the list of options below.
#### The `[leaflet-map]` shortcode provides these attributes:
| option | required | description | default | possible values |
|-------------------|----------|---------------------------------------------------------------------------------------------|-------------------------|------------------------------------------------------|
| lat | yes* | Latitude of the map center | 44.67 | latitude coordinate |
| lng | yes* | Longitude of the map center | -63,61 | longitude coordinate |
| address | no* | Street or City of the map center | N/A | e. g. New York (utilizes [Nominatim](https://nominatim.openstreetmap.org/ui/search.html)) |
| zoom | no | Zoom level of the map | 12 | 0-20 |
| min_zoom | no | Minimum zoom level of the map | 0 | 0-20 |
| max_zoom | no | Maximum zoom level of the map | 20 | 0-20 |
| height | no | Height of the map on the Wordpress Page | 250 | e. g. 500 (value in px) |
| width | no | Width of the map on the Wordpress Page | 100% | e. g. 600 (value in px) |
| attribution | no | Attribution of the map | ©Leaflet ©OpenStreetMap | html formatted text |
| draggable | no | Make the map draggable | true | true, false |
| fitbounds | no | Fit all markers on the map | false | true, false |
| zoomcontrol | no | Show zoom control | false | true, false |
| scrollwheel | no | Enable scroll wheel zoom | false | true, false |
| doubleClickZoom | no | Enable double click zoom | false | true, false |
| closepopuponclick | no | Close popups on click | false | true, false |
| detect-retina | no | Detect high resolution displays and fetch tiles at different zoom levels to appear smoother | false | true, false |
| tileurl | no | URL of the tile server | OSM tile server | any tile server url |
| tilesize | no | Size of the tiles | 256 | e. g. 512 (value in px) |
| subdomains | no | Subdomains of the tile server | abc | subdomains of the tile server |
_*The ```lat``` (latitude) and ```lng``` (longitude) options are only required when there is no address._
### Adding a Marker to your Map
You can set a marker by using the map provided by the shortcode helper (located in the WordPress sidebar) or simply add a marker with: `[leaflet-marker]` in a shortcode block on any page or post.
#### The `[leaflet-marker]` shortcode provides these attributes:
| option | required | description | default | values |
|-----------------|----------|-----------------------------------------------------------------|:--------|--------------------------------------|
| lat | yes* | Latitude of the marker | 44.67 | latitude coordinate |
| lng | yes* | Longitude of the marker | -63.61 | longitude coordinate |
| address | no* | Address of the marker | N/A | e. g. New York |
| title | no | Add a hover-over message to your marker (different than popup) | N/A | e. g. New York |
| draggable | no | Make the marker draggable | false | draggable (true), !draggable (false) |
| iconURL | no | URL for a custom marker icon | N/A | URL to the icon |
| iconSize | no | Size of the marker icon | 40, 60 | width, height |
_*the lat (latitude) and lng (longitude) options are only required when there is no address_
#### Adding a Marker Description
You can add a marker description by writing your text between the opening and closing shortcode tags, like this: `[leaflet-marker]Your text here[/leaflet-marker]`.
### Example
```wordpress=
[leaflet-map lat=47.223240595524516 lng=8.818641901016237 zoom=19 width=610 height=500]
[leaflet-marker]OST-RJ Building 8[/leaflet-marker]
```
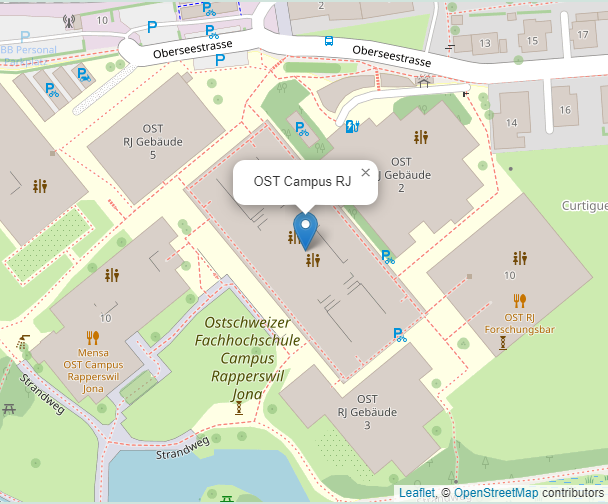
_Figure 10: Example location plan using WordPress Leaflet Map plugin_
:::info
**NOTE:** Should the WordPress Leaflet Map plugin not satisfy your requirements, you can have a look at some other plugins like [WP Map Block](https://en-gb.wordpress.org/plugins/wp-map-block/) or the [WP Open Street Map](https://en-gb.wordpress.org/plugins/wp-open-street-map/).
:::
If you wish to add multiple markers, you can simply add more leaflet-marker shortcodes like this:
```wordpress=
[leaflet-map lat=47.223240595524516 lng=8.818641901016237 zoom=19 width=610 height=500]
[leaflet-marker lat=47.22334 lng=8.81752]OST-RJ Building 1[/leaflet-marker]
[leaflet-marker lat=47.22361 lng=8.81809]OST-RJ Building 2[/leaflet-marker]
[leaflet-marker lat=47.22275 lng=8.81801]OST-RJ Building 3[/leaflet-marker]
[leaflet-marker lat=47.22321 lng=8.81661]OST-RJ Building 4[/leaflet-marker]
[leaflet-marker lat=47.22374 lng=8.81674]OST-RJ Building 5[/leaflet-marker]
[leaflet-marker lat=47.22371 lng=8.81591]OST-RJ Building 6[/leaflet-marker]
[leaflet-marker lat=47.22321 lng=8.81861]OST-RJ Building 8[/leaflet-marker]
```
# POI Map (Use Case 2)
With this compilation you'll be able to create a map with POIs.
:::warning
**WARNING**: As said, this document focuses on web apps without an own server. But relying on other services has its limitations - especially when dealing with geospatial data which tends to become massive. When you realize that you have 1000 map objects and more being displayed by the web client, think about an own web server application, like the "[Castle Dossier Map](https://castle-map.infs.ch/)" ([Video](https://www.youtube.com/watch?v=mg_TGqLAmx8)).
:::
:::info
**NOTE: Pro tip**: Before you create your own map, have a look at the long [list of osm-based web apps](https://wiki.openstreetmap.org/wiki/List_of_OSM-based_services) or [OSM Apps Catalog](https://osm-apps.zottelig.ch/) – maybe someone else has already created what you need. This may save you a lot of time.
:::
## ... using uMap web application
A simple solution with no coding is using the free [uMap](https://umap.osm.ch) map editor and embedding it with HTML \<iframe\> tag. You only prepare the data as GeoJSON file. See, for example, figure 7. For more information see the material "Using uMap to create a thematic online map". https://openschoolmaps.ch/ > Teaching Materials.
<iframe width="100%" height="200px" frameborder="0" allowfullscreen src="https://umap.osm.ch/de/map/map-of-art-safiental-2020_2970?scaleControl=false&miniMap=false&scrollWheelZoom=false&zoomControl=true&allowEdit=false&moreControl=true&searchControl=null&tilelayersControl=null&embedControl=null&datalayersControl=true&onLoadPanel=caption&captionBar=false"></iframe><p><a href="https://umap.osm.ch/de/map/brunnenkarte-der-schweiz_529">⛶ View Larger Map</a></p>
_Figure 11 (👆interactive on the web!): Web map with uMap map editor. (Sources: POI by Art Safiental, Basemap © [OpenStreetMap](https://openstreetmap.org/copyright) contributors)._
## ... using MapContrib web application
[MapContrib](https://www.mapcontrib.xyz/) ([Wiki](https://wiki.openstreetmap.org/wiki/MapContrib)) is another way to create your own map without coding. You need to know how to create an overpass query. After creating the map you can access it on the [official site](https://www.mapcontrib.xyz/) or embed it in an ```<iframe>``` on your own website.
## ... using MapComplete web application
With [MapComplete](https://mapcomplete.osm.be/) ([Wiki](https://wiki.openstreetmap.org/wiki/MapComplete)) you can create your own map for your theme. You can start with an unofficial theme without coding and go further to create a official theme. See https://github.com/pietervdvn/MapComplete#user-journey .
## ... using HTML Image Map file (via QGIS desktop application)
The OpenSchoolMaps material "Obtaining OpenStreetMap data and using it with QGIS 3". (https://openschoolmaps.ch/ > "Teaching materials") show a solution using QGIS. QGIS is a desktop application which can export a map to a static GIF image, e.g. using QGIS Plugin "[HTML Image Map Creator](https://plugins.qgis.org/plugins/html-image-map-creator/)".
## ... using JavaScript programming
[This map](https://www.myswitzerland.com/de-ch/erlebnisse/sommer-herbst/ausfluege/historische-schweiz/schloesser-und-burgen-suche/) from MySwitzerland about castles is an example of a map with POIs using plain JavaScript.
The following projects show all table tennis tables no more than 100m away from a public transport stop in the Canton of Zürich. The data gets imported from a GeoJSON. We generated the GeoJSON using overpass and added it to the project files.
### ... and Leaflet
You can find the example project using leaflet below. Dragging the divider on the left reveals the source code.
:::info
**TIP:** If you only want to show a few (amount in single digits) POIs on a map, you may find it easier to simply [add them manually](#…-and-Leaflet0), as shown in the chapter 'Location Plan'.
:::
Leaflet is fairly straightforward and does not need a lot of setup to display a map with points of interest from a GeoJSON source. The code is also rather self-explanatory.
There are a few parts, though, that we would like to highlight:
* `map.attributionControl.setPrefix(false);` removes the Leaflet attribution in the bottom right-hand corner.
* `map.on("move", ...);` does not get called when the map is initially loaded. In our example this means we have to insert proper lat/lon/zoom values into the 'Report a problem' when constructing it.
* You can also load a GeoJSON file from a remote server by simply entering the remote URL into the `fetch` command.
<iframe src="https://codesandbox.io/embed/leaflet-tabletennis-forked-mh4yvo?fontsize=14&hidenavigation=1&theme=dark&module=/src/index.js,/index.html,/src/styles.css"
style="width:100%; height:600px; border:0; border-radius: 4px; overflow:hidden;"
title="leaflet-marker"
allow="accelerometer; ambient-light-sensor; camera; encrypted-media; geolocation; gyroscope; hid; microphone; midi; payment; usb; vr; xr-spatial-tracking"
sandbox="allow-forms allow-modals allow-popups allow-presentation allow-same-origin allow-scripts"
></iframe>
_Figure 12 (👆interactive on the web!): Demo POI Map project showing table tennis tables. Uses Leaflet in CodeSandbox._
### ... and OpenLayers
Compared to Leaflet, OpenLayers requires a lot more code to set up such a map. It also does less for you by default. For example, you have to define an icon for the POIs yourself (we copied over the marker icon from leaflet, so that it looks similar), otherwise it just inserts a circle at the designated coordinates. However, it is more flexible with coordinate transformations.
There's another demo project below. Dragging the divider reveals the code, as above.
A few things to note:
* Coordinates are generally entered as 'lon, lat' instead of 'lat, lon'
* By default, icons are centred at their location. If your icon is a marker - like in this example - you have to define an offset so that the pointy bottom part gets put at the point's coordinates. `anchor: [0.5, 1]` works well for this icon. `0.5` centres it on the horizontal axis and `1` moves the icon upwards so that the bottom is aligned with the coordinates.
* `map.on("moveend", ...);` also gets called when the map is initially built. In our case this means that, unlike with leaflet, we do not have to insert proper initial values for lat/lon/zoom into the 'Report a problem' link.
* The map internally uses EPSG:3857. To convert coordinates to EPSG:4326, use ```ol.proj.transform(
your_data_source,
"EPSG:3857",
"EPSG:4326"
);```
* You can also load a GeoJSON file from a remote server by simply entering the remote URL into the `url` property of the object for the `VectorSource` constructor.
<iframe src="https://codesandbox.io/embed/openlayers-tabletennis-forked-g8g4k7?fontsize=14&hidenavigation=1&theme=dark&module=/src/index.js,/index.html,/src/styles.css"
style="width:100%; height:600px; border:0; border-radius: 4px; overflow:hidden;"
title="leaflet-marker"
allow="accelerometer; ambient-light-sensor; camera; encrypted-media; geolocation; gyroscope; hid; microphone; midi; payment; usb; vr; xr-spatial-tracking"
sandbox="allow-forms allow-modals allow-popups allow-presentation allow-same-origin allow-scripts"
></iframe>
_Figure 13 (👆interactive on the web!): Demo POI Map project showing table tennis tables. Uses OpenLayers in CodeSandbox._
### ... and Vue Leaflet
The example code below demonstrates how a map showing POIs can be set up using Vue and the [Vue-Leaflet](https://github.com/vue-leaflet/vue-leaflet) library.
Please note that Vue-Leaflet is still in beta. Hence, some functionality might not work or might be missing entirely When creating the demo project below, we noticed that:
* adding map boundaries (to prevent the user from moving the map too much) is not currently possible / working.
* the transition between zoom levels is - unlike with regular leaflet - not animated at all.
There are a few things we think are important to note:
* `{attributionControl: false}` removes the leaflet attribution that gets inserted by default. If you want your attribution to fit nicely in the bottom right corner, this needs to be set to false, as this plugin doesn't combine both attributions and displays one above the other.
* By default, l-map's css `height` and `width` attributes are set to 100% inline. To use custom dimensions, override these values with `!important`.
* In order for the map to display correctly, import the css inside the `<script>` tag either in the component where you use `<l-map>` or any parent component.
* We set the GeoJSON in `created()` rather than directly assigning it to the `geojson` property. Both variants are fine, but if you want to add a GeoJSON from a remote source (e.g. using `fetch`), you would have to do it in `created()`.
* To read the GeoJSON from a local source, you need to add `json-loader` to your project (`npm install json-loader`). For the loader to detect `.geojson` file suffixes, you need to add a rule to the `configureWebpack` property in `vue.config.js`, as shown below:
```javascript=
module.exports = defineConfig({
// ...
configureWebpack: {
module: {
rules: [
{
test: /\.geojson$/,
loader: 'json-loader'
}
]
}
}
})
```
_Listing 2: Webpack rule to let json-loader detect .geojson files_
Have a look at the code for the map component below:
```vue=
<template>
<l-map
class="map"
ref="map"
v-model:zoom="zoom"
v-model:center="center"
:options="{attributionControl: false}">
<l-tile-layer
url="http://tile.osm.ch/osm-swiss-style/{z}/{x}/{y}.png"
layer-type="base"
name="Swiss Style OSM"
></l-tile-layer>
<l-geo-json :geojson="geojson"></l-geo-json>
<l-control-attribution
position="bottomright"
:prefix="attribution"
></l-control-attribution>
</l-map>
</template>
<script>
import {
LControlAttribution,
LGeoJson,
LMap,
LTileLayer
} from "@vue-leaflet/vue-leaflet";
import tableTennisGeoJson from "/src/assets/table_tennis_zh.geojson";
export default {
name: "MapComponent",
components: {
LMap,
LTileLayer,
LGeoJson,
LControlAttribution
},
data() {
return {
zoom: 10,
center: [47.41330, 8.65639],
geojson: null,
attribution: "Data © " +
"<a href='http://openstreetmap.org/copyright'>OpenStreetMap</a> " +
"contributors <a href='https://opendatacommons.org/licenses/odbl/'>ODbL</a> | " +
"Map by <a href='https://sosm.ch/'>SOSM</a> | " +
"<a id='problem-attribution' " +
"href='http://www.openstreetmap.org/fixthemap?" +
"lat=47.41330&lon=8.65639&zoom=18'>Report a problem</a>",
};
},
async created() {
this.geojson = tableTennisGeoJson;
},
watch: {
zoom() {
this.updateProblemLink();
},
center() {
this.updateProblemLink();
}
},
methods: {
updateProblemLink() {
this.$el.querySelector("#problem-attribution")
.href = "http://www.openstreetmap.org/fixthemap?" +
`lat=${this.center.lat}&lon=${this.center.lng}` +
`&zoom=${this.zoom}`;
}
},
}
</script>
<style scoped>
</style>
```
_Listing 3: Example code for a POI Map using Vue Leaflet_
Due to technical constraints in CodeSandbox, this project is not available there. To view this example in a browser, click [here](https://geometalab.gitlab.io/web-map-demos/vue-geojson-demo/). (If the POIs don't load a few seconds after the page has loaded, try reloading it). The complete project can be found [here](https://gitlab.com/geometalab/web-map-demos/vue-geojson-demo).
## ... using WordPress
You can use the [Leaflet Map](https://wordpress.org/plugins/leaflet-map/) plugin to add a location plan to your WordPress website. The plugin is free and open-source. The GitHub Repository can be found at [github.com/bozdoz/wp-plugin-leaflet-map](https://github.com/bozdoz/wp-plugin-leaflet-map#available-shortcodes).
In this example, we are going to work with a GeoJSON file, which we extracted from OpenStreetMap using Overpass.
:::info
**TIP 1:** How do I convert my own data to GeoJSON? To create a GeoJSON file, you can use the [GeoJSON.io](https://geojson.io) interactive editor. To convert your data to GeoJSON, you can use an online tool like [Mapshaper](https://mapshaper.org) or [MiConv](https://miconv.com/de/), or even [GeoJSON.io](https://geojson.io).
**TIP 2:** If you only want to show a few (amount in single digits) POIs on a map, you may find it easier to simply [add them manually](#…using-WordPress), as shown in the chapter 'Location Plan'.
:::
### Creating POI Map with Leaflet Map Plugin
You can create a map with `[leaflet-map]` in a shortcode block on any page or post. The `[leaflet-map]` shortcode has many options, see the list of options below.
#### The `[leaflet-map]` shortcode provides these attributes:
| option | required | description | default | possible values |
|-------------------|----------|---------------------------------------------------------------------------------------------|-------------------------|------------------------------------------------------|
| lat | yes* | Latitude of the map center | 44.67 | latitude coordinate |
| lng | yes* | Longitude of the map center | -63,61 | longitude coordinate |
| address | no* | Street or City of the map center | N/A | e. g. New York (uses [Nominatim](https://nominatim.openstreetmap.org/ui/search.html)) |
| zoom | no | Zoom level of the map | 12 | 0-20 |
| min_zoom | no | Minimum zoom level of the map | 0 | 0-20 |
| max_zoom | no | Maximum zoom level of the map | 20 | 0-20 |
| height | no | Height of the map on the Wordpress Page | 250 | e. g. 500 (value in px) |
| width | no | Width of the map on the Wordpress Page | 100% | e. g. 600 (value in px) |
| attribution | no | Attribution of the map | ©Leaflet ©OpenStreetMap | html formatted text |
| draggable | no | Make the map draggable | true | true, false |
| fitbounds | no | Fit all markers on the map | false | true, false |
| zoomcontrol | no | Show zoom control | false | true, false |
| scrollwheel | no | Enable scroll wheel zoom | false | true, false |
| doubleClickZoom | no | Enable double click zoom | false | true, false |
| closepopuponclick | no | Close popups on click | false | true, false |
| detect-retina | no | Detect high resolution displays and fetch tiles at different zoom levels to appear smoother | false | true, false |
| tileurl | no | URL of the tile server | OSM tile server | any tile server url |
| tilesize | no | Size of the tiles | 256 | e. g. 512 (value in px) |
| subdomains | no | Subdomains of the tile server | abc | subdomains of the tile server |
_*The ```lat``` (latitude) and ```lng``` (longitude) options are only required when there is no address._
### Using GeoJSON File in Wordpress Leaflet Map plugin
You can use a GeoJSON file by using the `[leaflet-geojson]` shortcode. Place your GeoJSON file in `{path-to-your-wordpress-folder}/wp-content/uploads/`. This allows you to link the file in the src attribute of the leaflet-geojson shortcode.
It is also possible to include a GeoJSON from a remote source by simply setting the shortcode's src attribute to the GeoJSON's URL.
#### The `[leaflet-geojson]` shortcode provides these options:
| option | required | description | default | possible values |
|---------------|----------|---------------------------------------------------------------------------|---------|-----------------------------|
| src | yes | URL or path to your GeoJSON file | N/A | URL to the GeoJSON file |
| fitbounds | no | Fit all markers on the map | false | true, false |
| circleMarkers | no | Use circles instead of markers. Improves performance with a lot of points | false | true, false |
| radius | no | Radius of the circles, when `circleMarkers` is set | N/A | any number |
| iconurl | no | URL of the icon to use for markers | N/A | URL to the icon |
| iconsize | no | Size of the icon | N/A | e. g. 40,60 (width, height) |
### Example
```wordpress=
[leaflet-map fitbounds scrollwheel width=610 height=500]
[leaflet-geojson src=/wp-content/uploads/table_tennis_zh.geojson]
```
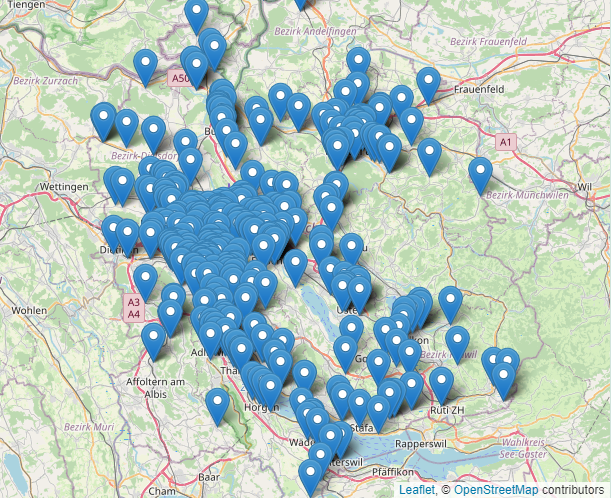
_Figure 14: Example POI map using WordPress Leaflet Map plugin._
:::info
**NOTE:** Should the WordPress Leaflet Map plugin not satisfy your requirements, you can have a look at some other plugins like [WP Map Block](https://de-ch.wordpress.org/plugins/wp-map-block/) or [WP Open Street Map](https://de-ch.wordpress.org/plugins/wp-open-street-map/).
:::
# OSM Services for POIs
* Webapp Overpass Turbo and webservice Overpass for retrieving POIs: https://dev.overpass-api.de/overpass-doc/de/ (more https://giswiki.hsr.ch/Overpass_API)
* Webservice OpenRouteService POIs: https://openrouteservice.org/services
* See also Maptiler.com or Mapbox.com for retrieving POIs.
# OSM-based Frontend Map Libraries
The JavaScript libraries Leaflet and OpenLayers are the most prominent and powerful means to create your own web map.
New vector tiles technologies provide more flexibility when rendering base maps locally on the client. However, they also still struggle with large amounts of local raster and vector data.
* Leaflet (recommended):
* https://leafletjs.com/ perhaps with Vector Tiles extension: see https://openmaptiles.org/docs/website/leaflet/
* Leaflet for VueJS: https://github.com/vue-leaflet/vue-leaflet
* Leaflet Mini-Template (outdated - will be updated soon): [code](https://gitlab.com/geometalab/web-map-demos/leaflet-openlayers-mini-template), [web page](https://geometalab.gitlab.io/web-map-demos/leaflet-openlayers-mini-template/)
* OpenLayers (more versatile handling of different Coordinate Reference Systems): https://openlayers.org/
* Vector Tiles, making the whole thing more complicated but also more flexible for personalized basemaps:
* "MapLibre GL JS": https://maplibre.org/maplibre-gl-js-docs/api/
"MapLibre GL JS" for VueJS: [Blog](https://documentation.maptiler.com/hc/en-us/articles/4413873409809-How-to-display-a-map-in-Vue-js-using-MapLibre-GL-JS).
* "Mapbox GL JS" Vector Tiles.
# OSM-based Basemap Services
Some often used tiles basemap layers in Switzerland:
* OSM Swiss Style (XYZ/WMTS): ```https://tile.osm.ch/osm-swiss-style/{z}/{x}/{y}.png```
* "OSM Standard" (XYZ/WMTS): ```https://tile.openstreetmap.org/{z}/{x}/{y}.png```
* "Luftbild swisstopo" (XYZ/WMTS): ```https://wmts.geo.admin.ch/1.0.0/ch.swisstopo.swissimage/default/current/3857/{z}/{x}/{y}.jpeg```
* swisstopo Landeskarte: ```https://wmts.geo.admin.ch/1.0.0/ch.swisstopo.pixelkarte-farbe/default/current/3857/{z}/{x}/{y}.jpeg```
::: success
**NOTE:** Don't forget to correctly attribute these basemap layers! See [this section below](#AttributionCopyright-on-Maps).
:::
Basemap services and styles beyond OSM.org standard tiles:
* Tile services from the Swiss OpenStreetMap Association ([SOSM](https://sosm.ch/)): https://sosm.ch/projects/tile-service/
* Maptiler services as Raster Tiles: www.maptiler.org (Freemium).
* Mapbox: www.mapbox.com
# OSM-based Geocoding Services
These are services that - given a geoname like "Eiffel Tower" - return its coordinates: [48.8582,2.2944 (map with marker)](https://www.openstreetmap.org/?mlat=48.85829&mlon=2.29450#map=18/48.85829/2.29450). "Instant Search" means suggesting fitting geonames based on what the user has already typed in.
* Nominatim: The "official" geonames search service behind OSM.org. Not suitable for instant search. Often does not match well since it initially was developed for data validation purposes: https://nominatim.openstreetmap.org/ui/search.html
* "OpenRouteService" web service for geocoding: https://openrouteservice.org/services
* Photon: https://github.com/komoot/photon (no public web service; you need to install / set it up yourself).
# OSM Services for Routing and Navigation
* Webservice OpenRouteService Routing and Directions: https://openrouteservice.org/services - includes "green routing" (see OSM services above).
* Routing OSM.ch https://routing.osm.ch - often better in pedestrian routing (also as service, OSRM based).
# Blueprints for OSM-based Web Map Projects
Blueprints for own web maps (no own backend):
* Sustainable Map by ToastHawaii: https://github.com/ToastHawaii/sustainable-map
* "Leaflet vs. OpenLayers": http://dennisligtenberg.github.io/leaflet-0.7.3vs.openlayers-3/index.html (needs to be updated!)
# Map Styles and Icons
* Map Icons: Maki (License CC0) https://labs.mapbox.com/maki-icons/ and Temaki (License CC0) https://github.com/ideditor/temaki
* (Vector Tile Styles... tbc.)
# OSM and GIS Tools
* Online GeoJSON editor: https://geojson.io
* Online Validating GeoJSON: https://geojsonlint.com/
* The Bounding Box (bbox) Tool (online): https://boundingbox.klokantech.com/
* Converting spatial data formats (GeoJSON, GeoPackage, Shapefile, KML, GPX, WMS, WFS, ...): Online https://geoconverter.infs.ch/ (offline: Use OGR/GDAL locally e.g., by installing QGIS.org)
* More on GIS formats with Python tools: https://annefou.github.io/metos_python/02-formats/
:::info
**NOTE - TIP**: Coordinates are coded internationally as latitude and longitude (lat/lon), e.g. `47.22333 8.81755`; latitudes have values between -90 and 90 and longitudes between -180 and 180 (old) degrees; limit the number of decimal places to five. Here's an example of how not to do it: `141,40338345345345 2,17403235325235`. These coordinates are badly formatted, because 1: latitude and longitude are swapped, 2: a comma instead of a dot is used as the decimal separator, and 3: there are too many decimal places.
:::
# Epilogue
## Checklist
Here's a checklist for your own location plan:
1. Is the map easy to understand, e.g., is zoom level OK?
2. Are there buttons for zooming in and out?
3. Is there an (optional) "⛶ View Larger Map" (which may be a shared link to [OSM.org](https://www.openstreetmap.org/?mlat=47.22563&mlon=8.81360#map=19/47.22563/8.81360) or [Qwant.com Maps](https://www.qwant.com/maps/place/osm:node:1356639459#map=17.50/47.22513/8.81447)) (with URL parameters `&lat=*&lon=*` among others).
4. Is there an (optional) weblink to a routing service, like search.ch or routing.osm.ch (with URL parameters `&lat=*&lon=*`)?
5. Is there anywhere in the HTML code of your website a [Place](https://schema.org/Place) or a [LocalBusiness](https://schema.org/LocalBusiness) type (as per Schema.org) containing geo and [openingHours](https://schema.org/openingHours) properties? It must be encoded as JSON-LD. Tip: Validate your website or snippet using the free "[Structured Data Testing Tool](https://validator.schema.org/)". Example of a 'Place' type: ```<script type="application/ld+json"> {"@context":"https://schema.org", "@type":"Place", "geo":{ "@type": "GeoCoordinates", "latitude":"47.2247", "longitude":"8.81459" }, "name":"Foto-Spot Rapperswil-Jona"}</script>```.
6. Does there exist a map copyright, like "© OpenStreetMap contributors" (see NOTE below)?
7. Does there exist a "[Report a problem](https://www.openstreetmap.org/fixthemap?lat=46.7984983&lon=8.2317843&zoom=8)" linking (URL with lat/lon) to OSM.
* For your own interactive POI map, all the checks from above apply, plus:
1. Is there a map title (a map key)?
2. Is it possible to share the shown section of the map or an actual POI?
3. Does there exist a search field for geonames?
## Attribution/Copyright on Maps
Here are some examples of attribution and copyright texts with links which typically are located at the lower right of the map:
* "OSM Swiss Style" tiles layer:
_Data © [OpenStreetMap](https://openstreetmap.org/copyright) contributors [ODbL](https://opendatacommons.org/licenses/odbl/) | Map by [SOSM](https://sosm.ch/) | [Report a problem](https://www.openstreetmap.org/fixthemap?lat=46.7984983&lon=8.2317843&zoom=8)_
* "OSM Standard" tiles layer (adapt the lat/lon URL parameters behind “Report a problem”):
_Data & Map © [OpenStreetMap](https://openstreetmap.org/copyright) contributors [ODbL](https://opendatacommons.org/licenses/odbl/) | [Report a problem](https://www.openstreetmap.org/fixthemap?lat=46.7984983&lon=8.2317843&zoom=8)_
* "Luftbild swissIMAGE" tiles layer:
_Data © [OpenStreetMap](https://openstreetmap.org/copyright) contributors [ODbL](https://opendatacommons.org/licenses/odbl/) | Map © [swisstopo](https://www.swisstopo.admin.ch/) | [Report a problem](https://www.openstreetmap.org/fixthemap?lat=46.7984983&lon=8.2317843&zoom=8)_
If "Report a problem" doesn't make sense, leave it out.
## Getting more help
More resources can be found in the list "[Awesome OpenStreetMap](https://github.com/osmlab/awesome-openstreetmap)" or on the [OSM.ch developer](https://www.osm.ch/entwickler.html) page.
We at the Swiss OpenStreetMap Association (SOSM) are happy to help you: https://sosm.ch/ > Contact.
---