2590 views
owned this note
# Explore, Clean and Integrate Data with OpenRefine (2021)
*This document is published on OpenSchoolMaps.ch -- Free learning materials on free geodata and maps and open source -- and stored on github.*
*Author*: Labian Gashi. For questions or feedback contact Stefan Keller (*stefan.keller@ost.ch*), Institute for Software at OST. 13. May 2021. © CC BY 3.0 CH.
### Organizational
* *Target Audience*: Students in Data Science/Engineering and self-learners.
* *Knowledge Prerequisites*: Basic knowledge about dealing with data, data types and SQL. This material involves low-code tools.
* *Keywords*: ETL, OpenRefine, Data Cleaning, Data Integration, Geocoding, Web Scraping.
* *Time Required*: About one hour for the reading part (without exercises), plus about five quarters of an hour for the exercises part - both depending on your previous knowledge and skills.
* *Software/Hardware Requirements*: See prerequisites below.
* *Preparations*: None - just software installation and data download.

*Figure: The OpenRefine logo.*
## 1. Introduction
### Goals and Objectives
This worksheet shows how you can use OpenRefine, a desktop tool for data pre-processing without programming (low-coding). A lot of ways are discussed to deal with data.
The exercise part will consist of some tasks that involve real-life examples of dealing with heterogeneous data and will try to show you what kind of approach we (as users) should be using when faced with different heterogeneous up to messy data problems/obstacles.
After completing this worksheet, you will be able to:
* Understand **OpenRefine**.
* Use OpenRefine to **explore** data.
* Understand the challenges that heterogeneous data can pose and use OpenRefine to **clean** data.
* Use OpenRefine to **integrate** and merge two datasets.
* Use OpenRefine to **enrich** data using a geocoding service.
* Use OpenRefine to **access structured data** using web scraping a webpage.
### Prerequisites
In order to complete this worksheet, you need the following prerequisites:
* Hardware: At least 1 GB of free RAM available.
* Internet access (for software and data download and for the advanced chapters and exercises about services).
* Software: Java runtime and OpenRefine (available for Windows, Mac, Linux) as instructed below.
* Data: As denoted below.
### Installation of OpenRefine
In order to do the exercises, you need to have OpenRefine installed locally on your computer. Requirements are Java JRE installed on your system. Tested browsers are Firefox, Chrome or Safari; the browsers Internet Explorer and Edge are not supported. The installation instructions are located in OpenRefine's [installation section of the manual](https://docs.openrefine.org/manual/installing). Follow the instructions there.
:::info
:bulb: If you're having problems installing OpenRefine or an issue in general with OpenRefine, read first the [FAQ in the manual](https://github.com/OpenRefine/OpenRefine/wiki/FAQ), then follow the tips in [the manual](https://docs.openrefine.org/manual/troubleshooting). See also [this help page](https://librarycarpentry.org/lc-open-refine/setup.html).
:::
### Structure of this Worksheet
In this worksheet we will discuss OpenRefine which is a powerful tool to explore, clean, integrate and enrich data.
* In the next chapter, the basics of Data Integration and Data Enrichment will be explained.
* In chapters 3 and 4 we will explain the basics and functionality of OpenRefine.
* In chapter 5 we will be explaining what geocoding is and how it is done using OpenRefine.
* In chapter 6 we will scrape a Wikipedia web page using OpenRefine.
* The idea of the exercises in chapter 4, 5 and 6 is to strengthen the OpenRefine usage skills by going through a whole workflow using OpenRefine.
## 2. About Data Integration and Data Enrichment
**Data** can be structured or unstructured. With **structured** data we mean data modeled in attributes having data types. An address list (encoded in a CSV file) typically represents a structured data. **Unstructured** data is data stored in a plain text, like a novel. With this kind of data it's impossible to produce for example a serial letter. But even if the data is structured, it can contain heterogeneous and potential messy data. With **potential messy data**, we mean data with many missing data values and data with "wrong" format/shape - at least for our objective.
**Data integration** is the process of combining data from different sources into a single, unified view. The integration process begins with an import, and includes steps such as cleaning, schema mapping, and transformation. OpenRefine offers many features that are convenient for data integration (chapters 3 and 4).
A typical integration process is when two address lists coming from different, independent sources, need to be merged. This integration process will be explained in the first and second exercise (chapter 4).
**Data enrichment** is a term that applies to the process of enhancing and completing existing data. This can be done in different ways, like merging third-party data from an external source. Let's say you have some customer or friends data containing names and postal addresses. Enriching this data would mean adding geographic coordinates to the list. This is called **geocoding** and allows to visualize addresses on a map (see chapter 5).
Almost everyone is aware that search engines use crawlers (or bots) to "scrape" the web. **Web scraping** is the process of extracting data/content from a website for analysis or other use. It extracts the underlying HTML of a web page and extracts information out of it (chapter 6).
## 3. OpenRefine Basics
OpenRefine is an application tool that runs locally as a stand-alone application on your computer and uses a web browser as graphical user interface (GUI). It's written in Java and available as open-source and has it's roots in managing a knowledge base, like [Wikidata](https://www.wikidata.org/). There's by-the-way open source alternatives around such as [Workbench](https://workbenchdata.com/), which follows a similar concept but is written in Python.
OpenRefine reads and manages large quantities of tabular data, usually potential messy and unstructured. It doesn't need Internet access for most of it's functions, due to it running locally. This means that your working environment with OpenRefine is private since everything is performed locally.
Referring to the generic tasks mentioned in chapter 2, these are the things OpenRefine can do:
* Explore the data, e.g. faceting and clustering.
* Clean potential messy data, e.g. unstructured (or semi-structured) text files.
* Data transformation - Bulk transformation of data, e.g. data normalization, data formatting.
* Data validation and deduplication.
* Data reconciliation with external services, such as Wikidata.
* Accessing web site data.
### The Graphical User Interface (GUI)
OpenRefine offers an interactive Graphical User Interface (GUI) that visualizes each step of working with your data set. It consists of a main grid (or spreadsheet) with the tabular data you are currently working on.
This spreadsheet changes every time you perform an action such as filtering or creating different facets. The left part of the GUI has a tab for showing each facet/filter that is currently affecting your data set. This section offers the possibility of quickly changing facets and filters and every time you perform such action, the spreadsheet reflects the changes.
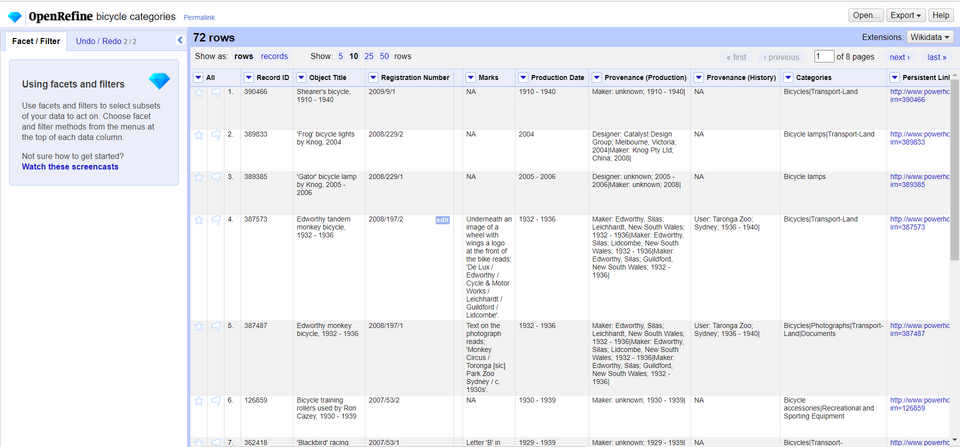
*Figure: The OpenRefine GUI.*
:::info
:bulb: These are some important terms used in OpenRefine: Since OpenRefine uses a tabular data model, there are **columns** (similar terms: field, attributes, cells) and **rows** (similar terms: records, lines). Then there's **reconciliation** (similar terms: integration, conflation), the process of matching your dataset with that of an external source.
:::
OpenRefine also has a powerful **Undo / Redo** - or history - feature which is a strong safety measure that allows you to work freely and experiment with your data as much as you want. Each action that you perform on the data set is tracked by OpenRefine, allowing you to comfortably make any transformations you want to do on your data set, with the possibility of quickly reverting those changes.
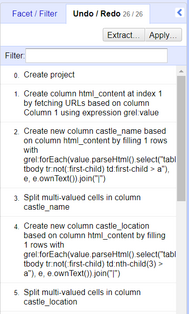
*Figure: Undo/Redo feature of OpenRefine.*
You can also extract all the project steps made or even apply a change set using a simple JSON file.
On the left of each row on your dataset is a flag and a star icon. Marking them persists even if you close/open your project and the idea of using these is marking your rows as starred or flagged for focusing later on them.
You can add stars/flags to your rows individually or you can apply them to all of the matching rows by using the special column *All*. Faceting (something you will learn later on in the worksheet) by stars/flags is also possible.
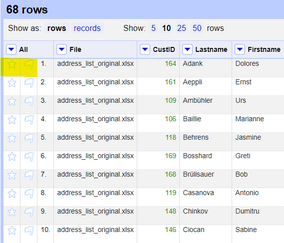
*Figure: The flag and star icon located on the left of each row of your dataset*
### Projects
An OpenRefine **Project** is a "workspace" for your dataset within OpenRefine. It is created by importing some existing data into OpenRefine. First you import your data (by various ways), then you configure the parsing options and proceed to create the project. As soon as you create the project, it is stored in a different file from your original one (in OpenRefine's workspace) and you don't have to worry about accidentally modifying your original file.
**Exploring data** within OpenRefine helps you learn more about your dataset. Typical questions while exploring are:
* Which attributes are text, discrete and which are continuous?
* What kind of values does each attribute have?
* How are the values distributed?
OpenRefine assigns a data type to each cell of the dataset where some of the cells have a recognized data type found from OpenRefine and some do not (they default to string at first). Every data type has specific functions that you can perform on them but not necessarily on others, and many data types can be converted to other data types (if necessary).
:::info
:bulb: OpenRefine stores a project into a separate directory after you create the project and doesn't ever modify your original file. For more information on how OpenRefine handles projects and on their storage, check out [this documentation](https://docs.openrefine.org/manual/installing).
:::
## 4. OpenRefine Functionality
In this section, we will be first describe OpenRefine's reader/input and explore its functions. Then, transformation functions are presented. Finally, we will be describing how exportation of data is handled in OpenRefine.
OpenRefine's most valuable functions are explorations - facets which allow to quickly explore the values of a given column - and transformations which offer many options to manipulate the data. Understanding these features is key to understanding the whole "lifecycle" of an OpenRefine project and will also come in handy in the worksheet exercises.
### Importing and Exploring Data
OpenRefine works by first importing a file from your machine or somewhere in the internet, and then creating a "project" out of it. After the data cleaning/manipulation is done, you can then export that data to a specific file format for use.
#### Importing
Importing is the first step when working with OpenRefine. The following formats are supported for importing in OpenRefine: CSV, TSV, JSON, XML, Microsoft Excel spreadsheets (.xslx, .xls), HTML tables (.html), Google Spreadsheets (online).
:::info
:bulb: OpenRefine also offers the possibility of importing data from an existing database source.
:::
#### Facets
After having opened an unknown data source, one of the first things is to explore it. So one wants to "see" the data contents and also to determine the data types of the columns. Data types are important because they allow different operations in it. Some basic data types are text, number, date/time, boolean (true/false) and enumeration (red,yellow,green).
:::info
:bulb: Data types are important. Programs like Superset/Tableau/PowerBI and even MS Excel have built-in functionality to guess the type. In OpenRefine see the option "Parse cell text into numbers, dates, ..." when importing a CSV.
:::
Facets are an important feature of OpenRefine which takes it beyond spread sheets and traditional database tools. They indicate the data variance in a given column. Faceting allows us to get a better picture on the whole dataset, allowing us to view the data from a bigger perspective.
What a facet does is that it groups values (e.g. of data type text or numeric) that are in a column, and enables the user to filter through and edit the values across various cells simultaneously, working as a browsing mechanism.
Usually, facets are created on a specific column by clicking on the column, selecting the *Facet* option and then clicking on one of the faceting alternatives.
If for example *Text Facet* is picked, what it does is take the total contents of the column cells and matches them up to show overall information about that column's values. You can then either manually enter a new value for the facet entry or use the OpenRefine *clustering* option which automatically takes care of the facet.
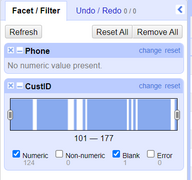
*Figure: Example of a numeric facet on numeric type "customer_id".*
#### Filtering
You can also filter specific column values in the data set by choosing the *Text Filter* option in the column dropdown menu. This creates a text box where you can insert the text you want to filter the column values.
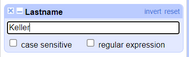
*Figure: Example of a text filter on the "Lastname" column.*
#### Clustering
Clustering is another important feature for grouping similar data which helps you identify data inconsistencies and misspellings. This is common in many data sets.
Clustering can be done by choosing a *Facet* on the column you want to cluster and then choosing the method you want to cluster your column values with.
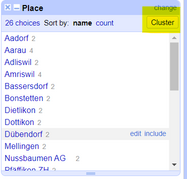
*Figure: Finding the Cluster button on a Text Facet*
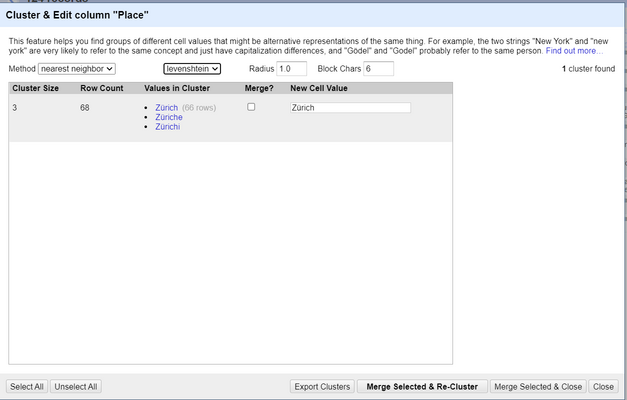
*Figure. Example of using the "nearest neighbor" clustering method.*
As you can see in the above image, this is an example for the *Zurich* city where the city's name was purposefully misspelled a couple of times. The clustering function finds those misspellings and offers us options on how to treat these types of misspellings.
:::info
:bulb: You can find out more about clustering in this [OpenRefine documentation page](https://docs.openrefine.org/manual/cellediting)
:::
### Transforming
OpenRefine offers some powerful features/functions for working with data. Some transformation functions include, among others:
* At value level:
* String operations
* At field/column level:
* Split and join multi-value cells
* Calculations in fields
* Adding constants
* Joining (concatenating) fields
There are also other OpenRefine functions that can transform your whole data set (bulk edit) with only a few clicks, such as:
* Re-ordering columns:
* Single re-order - Located on the dropdown of the column -> *Edit Column* -> *Move column to [direction]*
* Multi re-order - Located on the dropdown of the `All` column -> *Edit Column* -> *Re-order / remove columns...*
* Re-naming columns:
* Located on the dropdown of the column -> *Edit Column* -> *Rename this column*
* Sorting data:
* Located on the dropdown of the column -> *Sort...*, after that you have to choose the data type of the column values.
#### String Operations and Functions
OpenRefine offers some quick transforming operations that are useful when dealing with data. You can either use one of the preset transformations (out-of-the-box) or use the GREL language to implement your own transform function (requires light programming knowledge; see the separate chapter below).
Some of string operations include:
* Replacing quotes (common in messy data)
* Transforming text to other different data types
* Trimming whitespaces or other special characters
* Escaping/unescaping HTML characters
When using these operations correctly, one can quickly turn messy data into clean and machine-readable information.
Using *String Operations* on OpenRefine can be done by clicking the *Edit Cells* option on the column dropdown menu. When using string operations, you can choose one of the preset transformations offered by OpenRefine or write your own using the OpenRefine's GREL language, e.g. `value.toDate()` expression (see section below).
#### Splitting Fields
Another key feature of OpenRefine is the *Split* functionality that is useful for splitting column values into multiple columns. All you have to do is specify the character in-between the words and then OpenRefine will split those strings into multiple columns for you. This is very common when working with messy data, a lot of data within one column makes much more sense if split into multiple columns.
*Splitting fields* in OpenRefine is done by clicking on *Edit Column* and then *Split into several columns...*. This will let you specify a separator character(s) or a field length for separating your column values.
:::info
:bulb: You can also **split multi-valued cells** (with extra options) using the *Split multi-valued cells...* option.
:::
#### Joining Fields
Another option which is somehow the opposite of splitting fields is called *Joining Fields* and is used when we want to join fields using a separator (or without). The word is pretty self-explanatory.
*Joining fields* in OpenRefine is done by clicking on *Edit Column* and then *Join columns...*. This will offer you a selection of the columns you want to join and the separator between the content of each column. You can write the results in the same column or create a new column on the fly.
:::info
:bulb: You can also **join multi-valued cells** (just like splitting above) by using the *Join multi-valued cells...* option.
:::
### Joining datasets from different sources
A common scenario when working with data is receiving it from multiple sources. Although the data that is received ultimately serves a common purpose, the structure of it might not be the same across multiple sources. An example of this would be receiving two lists of customers with the same attributes but with e.g. different column names. Although from a human's eye it looks like the same data, that is not the case with computers. We have to apply some sort of techniques in order to integrate or rather "merge" these different sources of similar data.
There are usually three types of cases when joining datasets:
1. Extending the first dataset by another one which mostly has overlapping column names, a.k.a. **extend down vertically**
2. Enriching the first dataset by just one or few columns from another auxiliary dataset, a.k.a. **extend down horizontally by one or few columns**
3. Extend first dataset and it's rows by another complementing dataset, similar to the *SQL JOIN*, a.k.a. **extend horizontally**
Cases 1 and 2 need a common column called "key". Typical keys are identifiers such as postal ZIP codes, postal addresses (see Geocoding section below on the worksheet), country codes, municipality codes, ISBN, etc.
Some of the above cases are also demonstrated on this worksheet in exercises 2 and 3. The first case is showed on EXERCISE 2 and the second one is showed on EXERCISE 3. For the third case, there is no exercise on this worksheet that demonstrates it. OpenRefine offers no direct solution for it as of now.
### Validation and Deduplication
#### Validating the Dataset
OpenRefine also offers functions for validating your data against another data set. It can be done by creating a "Custom Text Facet" using the GREL `cell.cross()` function that matches values from two different columns. There is no native/straight-forward way for validating data sets but it can be achieved by using functions that behave in the same fashion as the GREL `cell.cross()` function.
#### Data Deduplication
For deduplicating the data, one of the ways you can achieve it is for example by using *Clustering* by key collision to find similar data. Then you can manually assess duplicate data and choose what to do with them after the clustering process is finished. This is usually a pretty straight-forward and efficient way of deduplicating a data set.
### Exporting
When you are done with working with the data and you have the data in the desired format, the last step is exporting that data into a specific file format.
The following formats are supported for exporting in OpenRefine: CSV, TSV, HTML table, Microsoft Excel spreadsheet (.xlsx, .xls), ODF spreadsheet (.ods), and some other custom exporters.
---
### EXERCISE 1: A first OpenRefine Workflow
In this exercise, we are going to demonstrate a typical workflow and lifecycle of an OpenRefine project, from its creation and until the data is ready to be exported.
#### Data
Use the following link to download the dataset required for this exercise: https://drive.switch.ch/index.php/s/mamC92Sr93ItSpm
#### Step 1: Creating a Project
In order to create a project (the actual workspace where we work with the data), you need to:
1. Open OpenRefine on your local web browser.
2. Choose the file you want to work with (or retrieve it directly from the Web), in our case, choose the file you just downloaded from the above link.
3. Click on *Next*.
4. After you have chosen what file to import, you need to configure the parsing options. The "preferred" options will automatically be chosen by OpenRefine but you can customize them if you like (see figure below).
5. Name the project and click on *Create Project* to create it on OpenRefine and start working on it (also saved for future use).
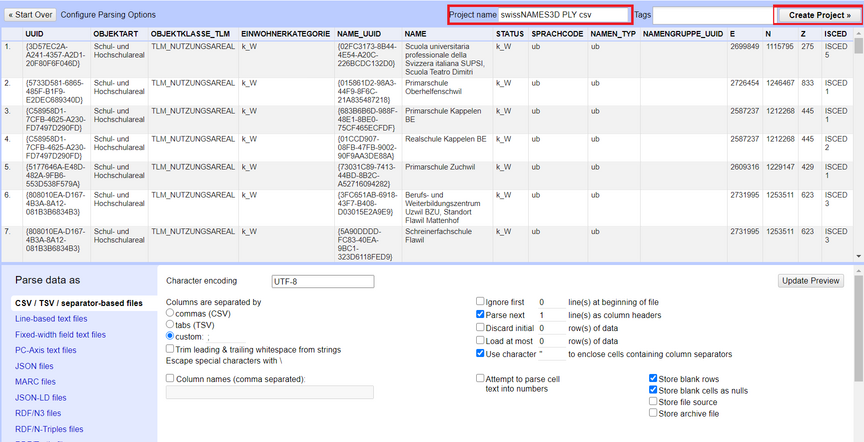
*Figure: Project parsing options.*
#### Step 2: Check data
We will refine the data set to filter out only customers from the Zurich canton and merge their addresses to a new column containing the full address.
1. Create a Text Facet on the `Place` column for filtering down to only customers living in the `ZH` Kanton
2. Merge the `Street`, `Place` and `ZipCd` columns into a new one, separated with the `, ` character (except the `ZipCd` column)
3. Add the country entry code to their phone numbers.
3.1 Add `+41` as the country code (for Switzerland)
3.2 Remove the `0` prefix on their phone numbers
3.3 Trim the white spaces from the phone number (e.g. +41445308197)
:::info
:bulb: One way of doing string manipulation (third step) is by applying the following GREL expression: `value.replace(value, "+41" + value.substring(1)).replace(" ", "")`. There are of course multiple ways, but it is encouraged for you to create your own.
:::
#### Step 3: Exporting the data
After you have finished the above tasks, you can export your data set (project) by clicking on *Export* -> *Excel 2007+* and OpenRefine will export your current data set into a new Excel spreadsheet.
---
### EXERCISE 2: Integrating another Dataset
In this exercise we are going integrate a "source" data set into a given "target" one. The source dataset contains similar data like the target one but with different column names and structure. Scenarios like this are very common in real life where we receive a lot of data sources about practically the same data. Ultimately, all of these sources of data we receive will need to be integrated/merge into one final data set containing all of the data from all of the sources.
We are going to use different methods and techniques in OpenRefine in order to successfully integrate (merge) two data sets into one. This will involve splitting/merging fields, mapping different attributes, deduplicating the data etc.
:::info
:bulb: This exercise also helps in demonstrating the first case (*extend down vertically*) of the *Joining datasets from different sources* chapter that you read earlier in the worksheet.
:::
#### Data
Use the following links to download the datasets required for this exercise:
* Target dataset (same as the one from EXERCISE 1) https://drive.switch.ch/index.php/s/mamC92Sr93ItSpm
* Source dataset: https://drive.switch.ch/index.php/s/tSY3CbNYmCzFE5t
#### Step 1: Creating the project
When you have downloaded both of the excel spreadsheets, create the project by:
* Uploading both of the files as the project files (OpenRefine supports multiple files import).
* Select both of the files in the "Select Files to Import page".
* Leave the default parsing options and click on "Create Project".
#### Step 2: Integrating the data
The *target dataset* is the same as the one from the first exercise and the purpose here is to integrate another data set i.e. the *source dataset* (with similar column names and values) into the *target dataset* including correct mapping and successful data integration and deduplication.
After creating the project, you will see a new column called "File" corresponding to the file that the record belongs to. This column "File" is also called the **key** column when merging two datasets because it is the column we rely upon for differentiating where the data is coming from (See the first case in the *Joining datasets from different sources* chapater chapter earlier in the worksheet).
The dataset will show a total of all the rows from both of the files, containing all the columns from both of the files. After the records from the first file (original/target dataset) are over, the grid will start displaying the records from the second file (scrambled/source dataset). You will also notice that some columns have the same name (purposefully), and therefore every record will have data on those columns.
Below you will find some screenshots which display how the data looks like and the progression of the records from the first to the second file.
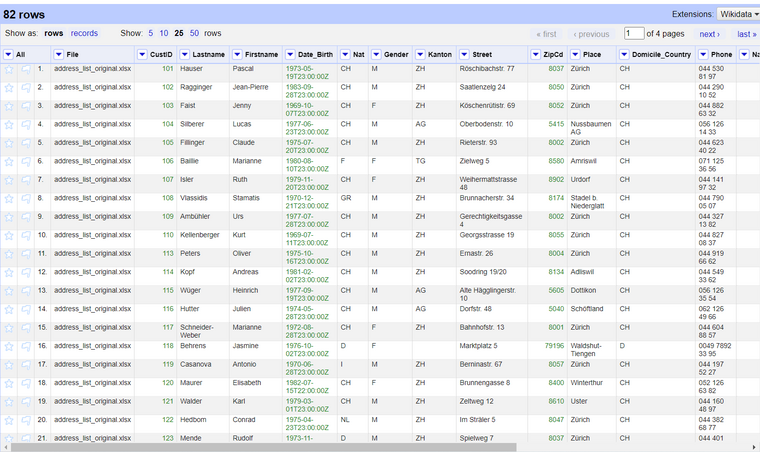
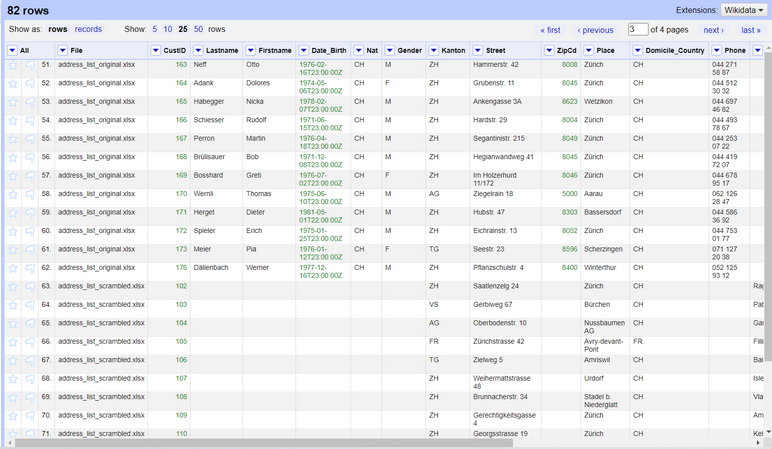
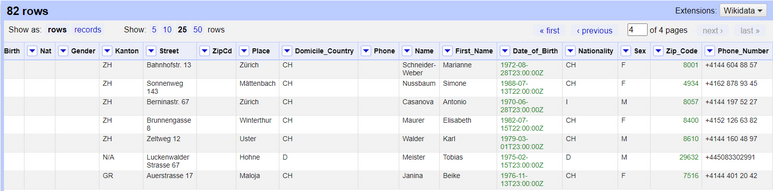
*Figures: Data from both of the files after importing both projects.*
#### Step 2.1 Joining and standardizing the columns from both files
First, we need to check the column names (from both files) and find out which ones of them belong to one-another. This part needs to be done manually.
When we find out the two columns corresponding to the same thing, we need to join them together. This will basically bring all the values from both of the files into a single column. Make sure that you leave the "separator" as an empty string when joining the columns.
You will see that in the columns that you joined, the first column will also take the values from the second column and we will have a value for each of our rows (from both of the files).
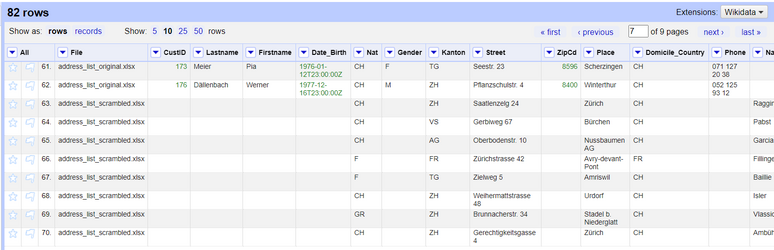
*Figure: Joining the "Nat" and "Nationality" columns from both of the files.*
Now do the same thing for all of the remaining columns and you will have a dataset with consistent columns.
When you have joined all the right columns, proceed by removing the other columns i.e. from the second file. This should leave you with a dataset containing all the data from both of the files, but with consistent and standardized column names. (Some columns can have the same name in both of the files, this was left on purpose).
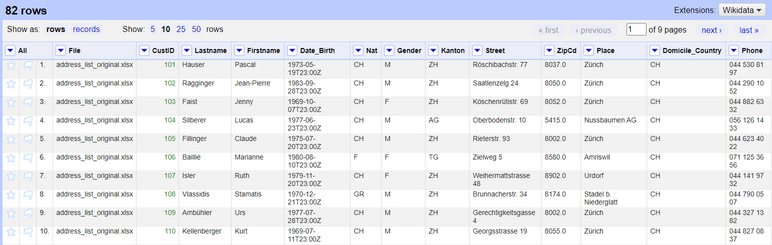
*Figure: Dataset after joining the columns from both of the files.*
#### Step 2.2 Deduplicating the data
The next step is to deduplicate the data. Some data from the second file is also present on the first file and this means that they are duplicates and we need to remove them and only keep one of the entries. There is also other data on the second file which is not present on the first file (i.e. not duplicate) so we shouldn't remove these.
For a record to be considered duplicate, we will be considering the following condition: If the first name, last name and birth date are the same, then we are talking about the same person, i.e. duplicate.
In order to do this, we need to use the *Duplicates facet* feature which is located under *Facet -> Customized facets -> Duplicates facet*.
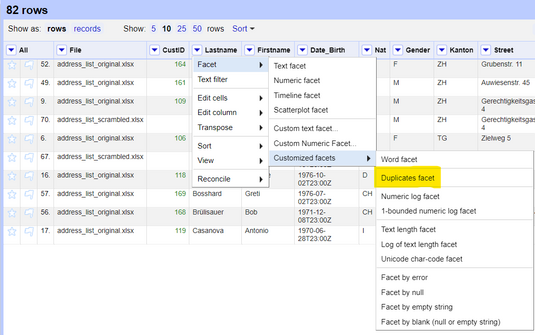
*Figure: Duplicate facets option on OpenRefine*
This facet returns `false` if the value is not duplicate and `true` if the value is a duplicate. The idea in our case is to create three duplicate facets which check for duplicates on the *Firstname* AND *Lastname* AND *Date_Birth* column.
Go ahead and create three facets for the three columns and select the `true` value on each one of them. This will return the columns that are now duplicates on all three values of the selected columns (our target).
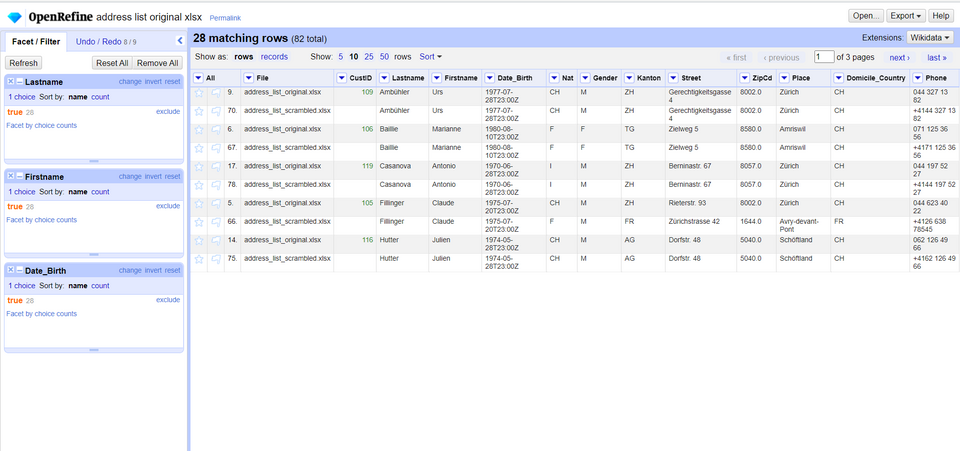
*Figure: Applying all of the duplicate facets on the dataset.*
Now we will be left with all the duplicate records, i.e. same first name, same last name and same date of birth. The next task is to alphabetically sort the records by any of the three columns (e.g. by *Firstname*). After you have sorted the column, choose *Sort* and then *Reorder rows permanently*. This is necessary in order to use the next function which blanks out the duplicate records (except the first one).
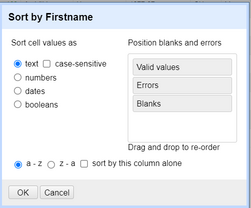
*Figure: Sorting by the "Firstname" column*
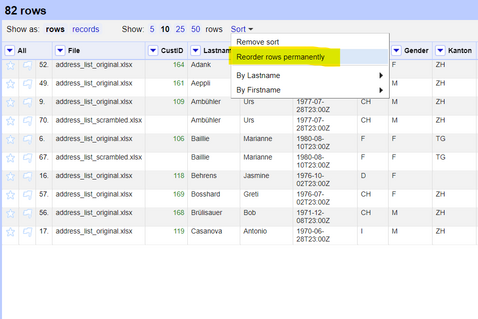
*Figure: Persisting the sorted values.*
When you have permanently re-ordered the rows (necessary step), go ahead and select the column you sorted and click on *Edit Cells* -> *Blank down*. This will blank out all the duplicate records (besides from the first one), which is exactly what we need.
Now you have to facet by blank on the rows. This is an OpenRefine customized facet which can be found under *Facet -> Customized Facets -> Facet by blank (null or empty string)*.
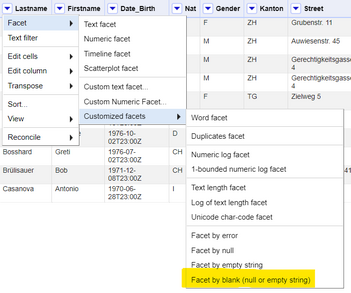
*Figure: "Facet by blank" option on OpenRefine.*
Select `true` on the facet created by the *Facet by blank* option and now you will be left with only the duplicate records (our target). Go ahead and click on the *All* column and select *Edit Rows -> Remove matching rows*. This will remove all the rows on the current selection (the duplicate records).
Remove all the facets by clicking on *Remove all*, and you will be left with only distinct records.
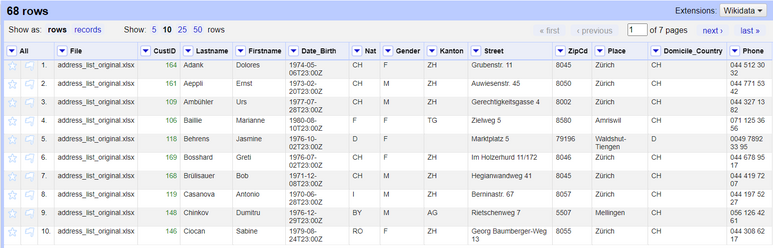
*Figure: Records after deduplication (and validation).*
#### Step 3: Finishing up
On the *Phone* column (or *Phone_Number*) there are some phone numbers with country code and some without. There's also spaces on some of the numbers and not on others.
Write a text transform function using GREL on the *Phone* column that will standardize all it's column values. You can do this by either adding the country code to all of them (who don't have it) or by removing it from the ones who have it. You also need to remove spaces from the values that have them, or add spaces to the ones who don't, it's up to you.
After you finish this last task, you will have integrated, validated and deduplicated a source dataset into a target dataset successfully.
#### Step 4: Exporting the data
Export the data into the *MS Excel 2007+ (.xslx)* format in order to finish this exercise.
## 5. Enriching Data with Geocoding
**Geocoding** is the process of converting/transforming a human-readable description of a location, such as an address or a name of the place in the actual location of it in the world (geospatial data). Geocoding is an important asset to geospatial data and location analytics. The idea of geocoding is to input description of a location and have the exact location outputted back to you (e.g. longitude and latitude, 'lat/lon'). **Reverse geocoding** is another concept (not as widely used) which is the opposite of geocoding, meaning, inputting the exact location of a place and having the address or place outputted back to you.
Geocoding can be done using online web applications or web services (APIs). There are multiple geocoding APIs we can use which typically come with cost.
In this worksheet, we will be demonstrating geocoding using **Nominatim** (see [Nominatim API](https://nominatim.org/release-docs/develop/api/Overview/), which relies on the open database [OpenStreetMap](https://www.openstreetmap.org/). This is an example of a Nominatim API call for the address "Obere Bahnhofstrasse 32b, Rapperswil" (from the [documentation](https://nominatim.org/release-docs/develop/)): ```https://nominatim.openstreetmap.org/search?format=xml&addressdetails=1&countryCodes=CH&format=geojson&limit=1&q=32b+Obere+Bahnhofstrasse,+Rapperswil```.
This returns the following GeoJSON (JSON) document (edited and shortened for educational purposes):
```JSON
{
"type": "FeatureCollection",
"licence": "Data © OpenStreetMap contributors, ODbL 1.0.",
"features": [{
"type": "Feature",
"properties": {
"osm_id": 3124300001,
"osm_type": "node",
"importance": 0.42099999999999993
},
"geometry": {
"type": "Point",
"coordinates": [8.8190421, 47.2269746]
}
}]
}
```
:::info
:bulb: You can find more about JSON at [www.json.org](https://www.json.org/json-en.html).
:::
:::warning
:exclamation: Please respect the *Terms of Service* of free webservices like the Nominatim API. The [Nominatim Usage Policy](https://operations.osmfoundation.org/policies/nominatim/) for example states that a maximum of repeated requests has to be done one per second. This means that you have throttle calls with a delay to 1000ms.
:::
---
### EXERCISE 3: Geocoding with OpenRefine
In this part, we will be using Nominatim as geocoding service along with OpenRefine. Since our dataset contains information about customer's address and country, we will be able to demonstrate geocoding with OpenRefine using this dataset.
:::info
:bulb: This exercise also helps in demonstrating the second case (*extend down horizontally by one or few columns*) of the *Joining datasets from different sources* chapter that you read earlier in the worksheet.
:::
#### Data
As explained in the introduction, for this part you will need to download a dataset of fictional data containing details about some customers and their addresses. Use the following link to download the dataset: https://drive.switch.ch/index.php/s/mamC92Sr93ItSpm
#### Step 1: Creating the Project
After you have the right dataset, open the OpenRefine program and create the project using the dataset you just downloaded.
With OpenRefine we will do the Nominatim API requests, fetch the data, parse the lat/lon out of it, then put it into the right columns.
#### Step 2: Joining the address columns
We need to concatenate address columns to one single column *Full_Address* in order to be ready for the geocoding call. We can do this using column joins and other functions, as follows:
1. Start by creating a new column which concatenates the *Street* and *Place* column. This will give us a new column which contains the street and the place.
2. Navigate to the *Street* column, clicking on the dropdown and selecting *Edit Column* -> *Join columns...*. This will open a pop-up window where you can specify which columns you want to join and the way you want to join them.
3. Select the *Street* and *Address* columns on the left and specify the `, ` separator between the content of each column on the right. Also make sure you select the *Write result in new column named...* radio button and specify the name as *Full_Address* because we want to create a new column out of these two.
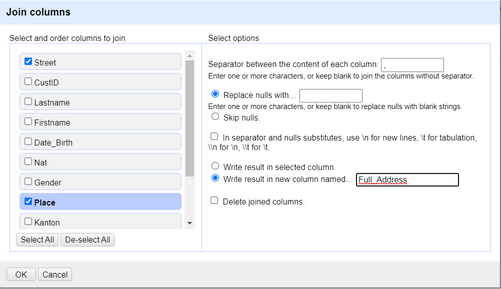
*Figure: Joining/concatenating columns on OpenRefine.*
4. Now you will have a new column called *Full_Address* which contains the address (with number) and the place part of the address. This will help the geocoding API with determining the location of the customer's addresses.
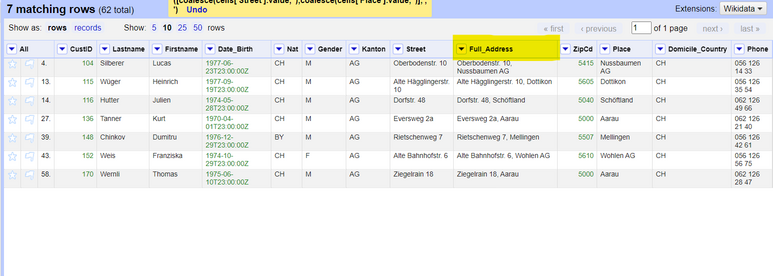
*Figure: OpenRefine grid after joining the "Address" + "Place" columns.*
#### Step 3: Using a Geocoding API with OpenRefine
Now, we have to call a Geocoding API using OpenRefine which will give us more information about our address, including lat/lon attributes.
1. We have to make a request to the Nominatim API where we will split the *Full_Address* column value and send it to the API and in return receive information about that location including the lat/lon (our objective) of it.
2. Start by clicking on the drop-down button of *Full_Address* column and select *Edit Column* -> *Add column by fetching URLs...*
3. Specify a new name for the column (*address_json* or *osm_json*, it doesn't really matter), change the *throttle delay* to 1000ms and write the expression as:
`
'https://nominatim.openstreetmap.org/search?street=' + escape(value.split(",")[0], 'url') + '&city=' + escape(value.split(",")[1], 'url') + '&format=json'
` and click on OK. This code will split the address column into two values (one contains the city and the other contains the place) and make an API request for receiving a GeoJSON object with the lat/lon coordinates of the location (the process of geocoding). We will also receive other information about the location but we are going to ignore those for now.
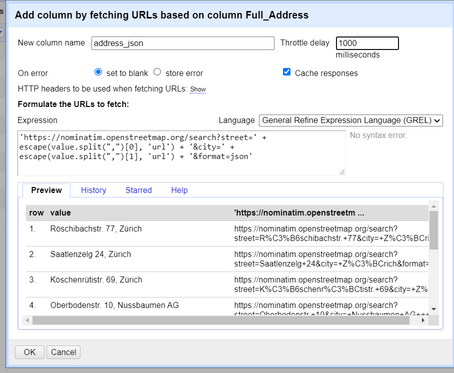
*Figure: Adding a column by fetching an URL (API Call) using GREL.*
4. Now you will have a new column containing the API response for the request we made, if you format/beautify this JSON code, you will see that it contains information about the location including lat/lon attributes, the bounding box, OpenStreetMap ID/Type etc. as shown above.
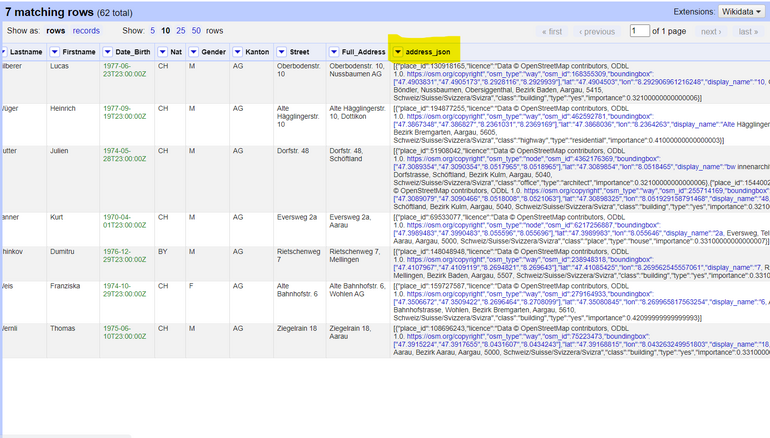
*Figure: OpenRefine grid after the "address_json" column is added".*
:::warning
:exclamation: Retrieving data from the internet might take some time, so please be patient. If you want to complete the process faster, you can use facets to narrow down the dataset to less records, e.g. by filtering only the records with the value "AG" on the *Kanton* column.
:::
#### Step 4: Parsing the JSON and creating the coordinate (lat/lon) columns
Now that we have the JSON object containing information about our customer's locations, we can use that JSON object to create new columns out of it, such as lat/lon.
In order to do this, we need to:
1. Click on the drop-down of the newly column you just created by calling the API.
2. Click on *Edit column* -> *Add column based on this column...* (Insert picture here).
3. Specify a name for the new column(e.g. *lat* or *latitude*) and use the *Expression* box to parse the JSON and read the desired attribute by typing: `value.parseJson()[0].lat`. You can see the preview of the column after evaluating the expression. Click OK and you will see a new column for the latitude coordinate.
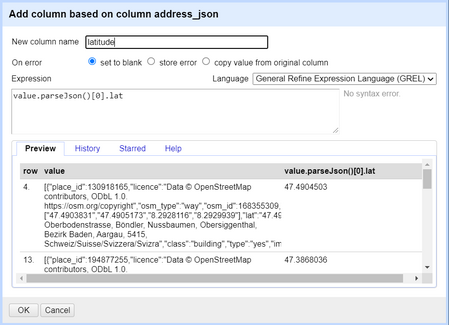
*Figure: Extracting the "latitude" attribute from the json object we received.*
4. Do the same thing for the longitude coordinate 'lon'.
5. After you have the lat/lon columns, finish up by deleting the column with the full json string for a cleaner look. You can also remove the *Full_Address* column if you like, since it's not necessary anymore.
Now you'll be left with a clean dataset containing *lat* and *lon* coordinates for the customer addresses which you retrieved using OpenRefine and geocoding APIs. There might be some locations that weren't found by the API. In this case, we can use a facet to filter out the empty values and then manually modify those addresses and find out what's wrong with them, and then re-make the API request.
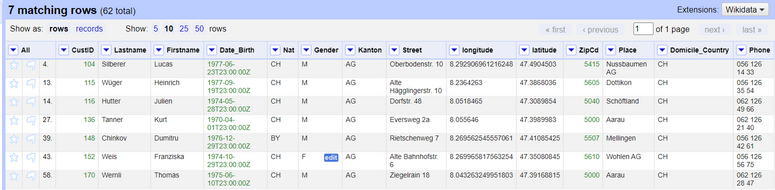
*Figure: Final look of the dataset after geocoding and cleaning it.*
## 6. Web scraping
In this section, we are going to do some web scraping using OpenRefine. We can use functions to first fetch and parse a web page, which consists of HTML text, and then filter the data to the desired columns.
OpenRefine's GREL functions allow us to parse the HTML page into HTML text content and then use different methods for selecting the right tags, attributes, text nodes etc. .
Let's first explain a typical HTML structure and then what GREL is.
### HTML and DOM
HTML is the standard markup language for web pages. It is not a programming language but rather an interpreted one and it describes the structure of a web page.
Web pages are written in HyperText Markup Language (HTML). HTML is the standard language for documents designed to be displayed in a web browser.
The Document Object Model (DOM) is the data representation of the elements/objects that contribute to the content of a HTML document. The DOM plays a crucial part in web scraping since that can be used to access elements inside a web page (just like the DOM selector methods in JavaScript).
:::info
:bulb: You can find more about HTML [here](https://www.w3schools.com/html/html_intro.asp) and about Javascript DOM [here](https://www.w3schools.com/js/js_htmldom_methods.asp).
:::
### General Refine Expression Language (GREL)
A key feature of OpenRefine is the "General Refine Expression Language", short GREL. GREL is an expression language specific to OpenRefine, which is similar to JavaScript and is convenient for performing different functions such as:
* String operations
* Boolean operators
* Parsing HTML, JSON or XML
* Selecting HTML elements
* Iterating over elements etc.
GREL is going to be used in our case to access the HTML DOM and select the appropriate data out of the HTML page for scraping.
:::info
:bulb: For more information on GREL and its functions, you can read the official documentation from OpenRefine on these pages: [GREL](https://docs.openrefine.org/manual/grel) and [GREL functions](https://docs.openrefine.org/manual/grelfunctions).
:::
### EXERCISE 4: Web scraping with OpenRefine
For this exercise, we are going to
* Bring the HTML content into OpenRefine.
* Parse the HTML and its elements using OpenRefine's expression language GREL.
* Arrange the resulting columns.
We are going to scrape a Wikipedia page that contains a list of all the castles in the "Aargau" canton of Switzerland, like for example the Habsburg! First, we are going to bring the pure HTML content of that page into OpenRefine and then we are going to use different GREL HTML and text transform functions to parse out the correct data from the HTML content.
This is the Wikipedia web page we use in this exercise: ["Liste von Burgen und Schlössern im Kanton Aargau"](https://de.wikipedia.org/wiki/Liste_von_Burgen_und_Schl%C3%B6ssern_im_Kanton_Aargau).
#### Step 1: Creating the "HTML" project
There exist multiple ways for bringing the HTML content of a web page into OpenRefine, however for this exercise, we are going to use the *Clipboard* option of OpenRefine. Proceed by copying the link of the web page and then paste it into the *Clipboard* text area of OpenRefine's initial page.
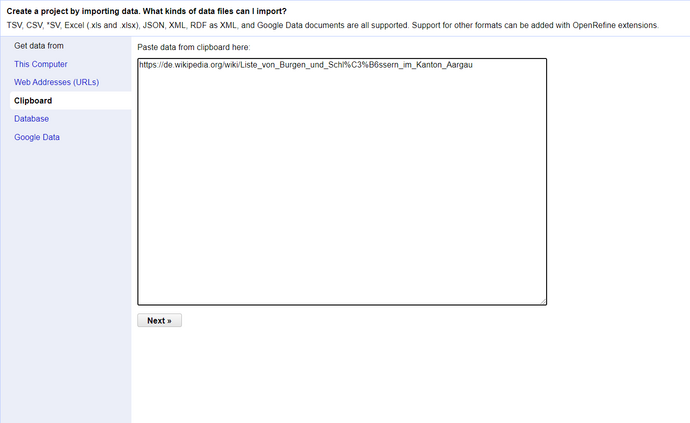
*Figure: Using the "Clipboard" option to create a project in OpenRefine.*
Configure your parsing options (leave them as default), name your project, click on *Create Project* and move on to the next step.
#### Step 2: Bringing the HTML content into OpenRefine
Now you will have one column and one cell simply containing the same link you copied into OpenRefine.
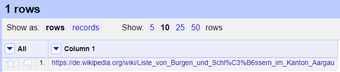
*Figure: The single column containing the URL of the webpage we are going to scrape.*
Now click on the dropdown of that column and select *Edit Column -> Add column by fetching URLs...*. Simply give a name to the new column, e.g. *html* or *html_content*, leave the expression as `value` and click on OK.
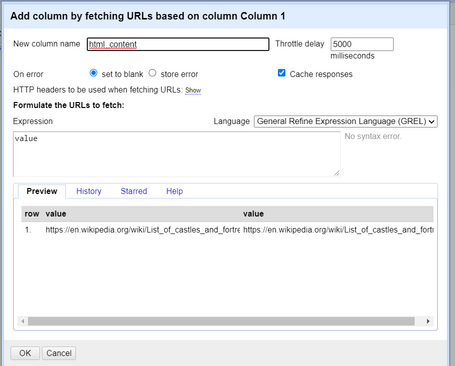
*Figure: Adding the whole HTML content in a new column using OpenRefine's "Add column by fetching URL" option.*
Now a new column will be created containing the whole pure HTML content of the web page we selected. We are going to use this column to extract the necessary information we need for the castles data.
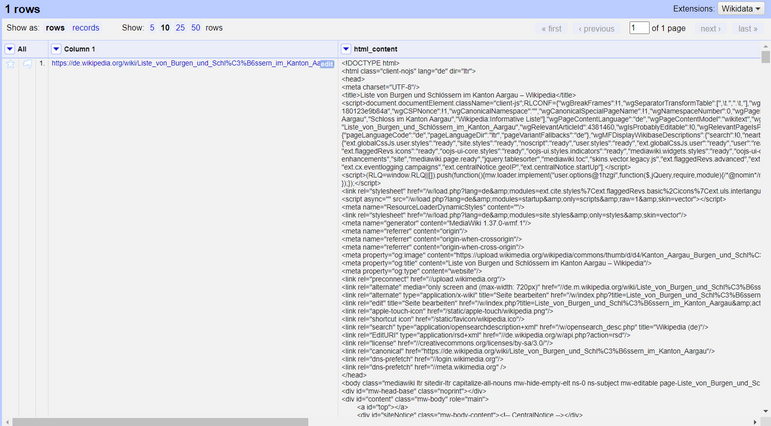
*Figure: The "html_content" column containing the full HTML content after adding the column by fetching the URL.*
#### Step 3: Parsing the HTML and its elements using GREL
Now we are going to use GREL's HTML parsing functions to parse the HTML and place it into the appropriate columns.
We are going to use a *forEach* iterative loop from GREL to loop through the appropriate elements and only extract the data about the castles. In the loop, we are going to use GREL's HTML parsing functions and basic CSS selectors logic to select the needed HTML elements.
1. Click on the drop-down of the HTML content column you just created and click on *Edit column -> Add column based on this column...*.
2. Place the following code into the expression box:
`
forEach(value.parseHtml().select("table.wikitable tbody tr td:first-child > a"),
e,
e.ownText()).join("|")
`.
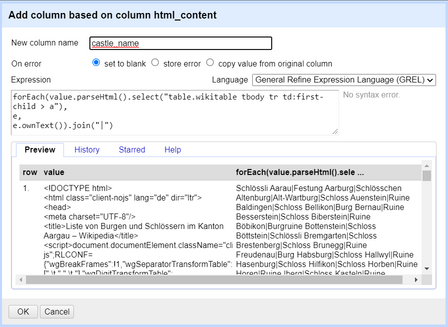
*Figure: Using GREL to filter out the data we need from the HTML content.*
3. This code loops through the elements specified in the first argument of the *forEach* loop using basic CSS selectors, gives a name to each element in the current iteration of the loop in the second argument (in our case: `e`) and then performs an action on each loop to that element (`e.ownText()`). After the loop is finished, we receive an array of those values, which we join with a `|` separator to then split into multiple cells.
4. We are left with a new column that contains a string of all the names of the castles, joined with a `|` character.
5. Now we have to split the string we received into multiple cells by separating them with the `|` separator (the reason why we did it in the first place). Click on the drop-down of the column you just created and click on *Edit Cells -> Split multi-valued cells...*. Choose the `|` separator and click on OK.
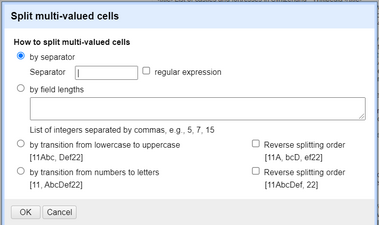
*Figure: Using the "Split multi-valued cells" option to split the string we created before using GREL.*
6. Now your new column should contain one row for each castle (containing the castle name).
7. Now proceed by extracting out the other necessary information castles such as: location, type, date, notes etc. It follows the same logic as above but you might have to change the CSS selectors and the action performed with the loop variable (e.g. `e.htmlAttr("title")` extracts the title attribute of the link etc).
When you have extracted all the necessary information for the castles, clean up your data set by removing the HTML content columns and other unnecessary data/columns. You will be left with a table containing the castles and fortresses of Switzerland, which you scraped from Wikipedia using OpenRefine.
There are multiple ways you can extract HTML content but as soon as you can receive all the information you need effectively, all of them are valid.
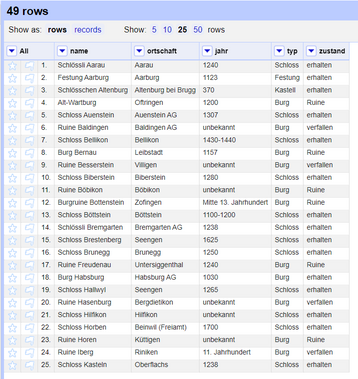
*Figure: Castles of Switzerland dataset after scraping the web page, transforming it and cleaning the data in OpenRefine.*
:::info
:bulb: There are some GREL functions that are necessary for extracting some of the HTML information from the HTML content here. You can take a look at them at the section above about GREL.
:::
## 7. Conclusion and Outlook
From the items discussed and explained above, you can see that OpenRefine is a handy tool for working with data, be that messy or not. However, knowing the correct functions to use when dealing with data is crucial!
A lot of logical, technical and hands-on knowledge is required before working with data and before transforming data into something meaningful and useful. The exercises hopefully taught you what kind of approach to use when dealing with messy data and knowing which function/tool to choose when faced with various data problems.
## 8. What we have learned
* Creating a project in OpenRefine.
* Exploring a dataset and transforming it with OpenRefine, using facets and other transform functions.
* Using OpenRefine to clean/deduplicate and integrate a data set into another one.
* Using OpenRefine for geocoding and for web scraping.
What we haven't learned here is many more built-in functions of OpenRefine - including e.g. date functions - and more complex analyses, like statistical data descriptions (mean, median), and mainly what Data Reconciliation is using OpenRefine. To learn more about this, look at the many resources mentioned in the following info box.
:::success
:bulb: Recommended reading: The book ["Using OpenRefine" by Verborgh & De Wilde](https://ruben.verborgh.org/publications/verborgh_packt_2013/) (Packt Publishing Ltd, 2013) is freely availably online. And there are many online tutorials and videos, like for example the [Library Carpentry OpenRefine lesson](https://librarycarpentry.org/lc-open-refine/) or the [Introduction video by the University of Idaho Library](https://www.youtube.com/watch?v=yTJ6x6zEQmI).
:::
---
## APPENDIX: Exercise Questions
These are exercises and questions about the material learned and a kind of repetition questions about OpenRefine and Data Integration.
**Question 1**: What are the challenges of data integration? Summarize in three sentences and give an example for each.
<!-- Possible answers:
1. Technical-/structural heterogeneities: Access methods, Data formats
2. Heterogeneities in database models/schematas
3. Semantic heterogeneities
-->
**Question 2**: Name some ETL functions from OpenRefine.
<!-- Possible answer:
Extract and load are "simple" local files or services or database.
Transform is the most interesting part: See important OpenRefine functions mentioned in EXERCISE 1 and 2.
-->
**Question 3**: Collect and note all important OpenRefine functions mentioned in EXERCISE 1.
<!-- Possible answer:
* Importing and exporting data
* Exploring data
* Filtering columns
* Standardizing columns (adding prefix phone number +41, removing white spaces..)
* Merging columns
-->
**Question 4**: Collect and note all important OpenRefine functions mentioned in EXERCISE 2.
<!-- Possible answer:
* Reading data from two sources, plus: joining the two tables
* Unifying columns
* Removing duplicates
* Join (merge) columns (don't mix-up with joining tables)
* Split multi-valued cells (separated by semi-colon)
-->
**Question 5**: Which OpenRefine function or process is equivalent to a SQL Join?
<!-- Possible answer:
Enriching a dataset by just one or few columns from another auxiliary dataset can be made through e.g. an extension like geocoding.
For the real join case there is no direct solution in OpenRefine as of now.
-->
**Question 6**: Which OpenRefine function is the SQL command "unnest" closest to?
<!-- Possible answer:
It's spliting a multi-value cells (i.e. cells containing separators, like semi-colon) into different rows. See "[Split multi-valued cells](https://guides.library.illinois.edu/openrefine/splitting)" (OpenRefine guide from Illinois Library).
-->