# Visualizing, Measuring and Clipping Point Cloud Data with QGIS (HS22)
*OpenSchoolMaps.ch -- Free learning materials on free geodata and maps*.
Seminar Thesis by Severin Weiss, MSE Seminar GIS & Location Systems, Autumn 2022
Keywords: Visualization, Point Cloud, 3D, Data Analysis, Geographic Information Systems, GIS, QGIS.
:::info
**Note**: This is a draft of a worksheet to be published potentially on [OpenSchoolMaps](https://www.openschoolmaps.ch/). For questions or feedback, please contact Stefan Keller <stefan.keller(ät)ost(dot)ch>.
:::
Organizational:
* *Target group*: Addressed are self-learners, students and teachers at universit level who are not necessarily computer scientists.
* *Time required*: This document will take approximately 30 minutes to read.
* *Software/Hardware requirements*: The software required is [QGIS 3](https://download.qgis.org/). This course material has been tested using latest installable version of QGIS 3 plus the latest long term release (LTR) of QGIS 3. QGIS runs on the popular operating systems Windows, MacOS und Linux. This tutorial was tested with QGIS 3.28.1.
* *Introductory competencies*: It is assumed that basic knowledge of using an operating system and basic knowledge of QGIS are present.
* *Preparations*: QGIS installed. For further preparations see section below.
::: success
**INFO:** If you are looking for clipping geographic raster data see https://md.coredump.ch/s/eiLVdmDGk# (in German).
:::
## 1. About this Document
The document starts with a short introduction what Point Cloud data is and some technical information. For illustrative purposes an example will be presented. The following sections will explain how to deal with Point Cloud data in the desktop software QGIS in terms of visualizing ([chapter 4](#4-Visualizing-Point-Cloud-Data-in-QGIS)), measuring ([chapter 5](#5-Measuring-Point-Cloud-Data)) and clipping ([chapter 6](#6-Clipping-of-Point-Cloud-Data-with-QGIS)). To finish an outlook and further resources are presented.
::: success
**INFO:** See [QGIS Documentation section 19. Working with Point Clouds](https://docs.qgis.org/3.28/en/docs/user_manual/working_with_point_clouds/point_clouds.html).
:::
## 2. An Example of Point Cloud data
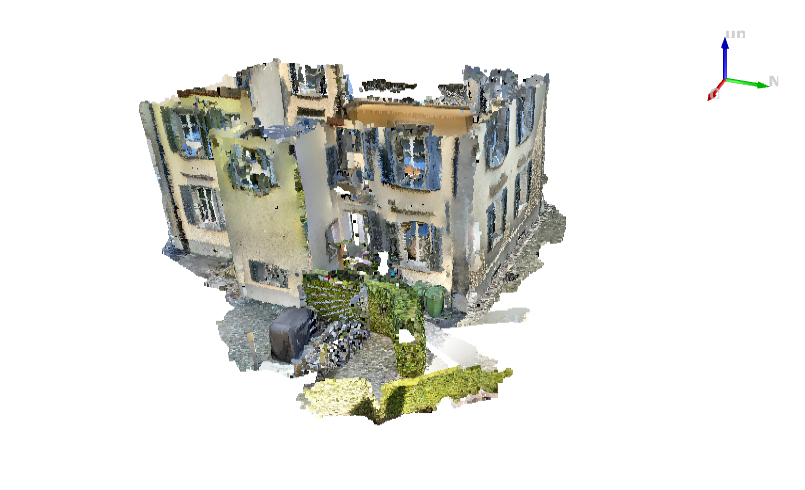
*Figure: The Villa Aurum in Rapperswil (SG) as an example of Point Cloud data visualized in QGIS.*
In the figure above you can see an example of Point Cloud data. By using the cursor in QGIS the villa can be inspected in by all three dimensions.
:::info
NOTE: Data of the Villa Aurum can be downloaded [here](https://drive.switch.ch/index.php/apps/files/?dir=/Villa%20Aurum&fileid=5608383999).
:::
## 3. What is Point Cloud data?
Point Clouds are a set of points in 3D space. Each point consists of a coordinate (X,Y,Z) plus additional attributes. A point cloud is typically created directly by a laser scan using LiDAR (light detection and ranging) or photogrammetric techniques such as 'Structure from Motion'. One of the challenges of point clouds is the enormous amount of data just to visualize and manage it.
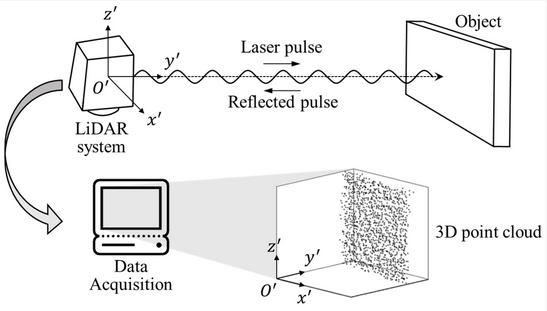
*Figure: Principle for acquiring 3D coordinate information of the object using the light imaging detection and ranging system. (Source: https://www.mdpi.com/1424-8220/20/3/721)*
### 3.1 Point Cloud Data Formats
A common open data exchange file format for Point Cloud data is LAS/LAZ. The LAS (LASer) format is a file format designed for the interchange and archiving of lidar point cloud data. The format is widely used and regarded as an industry standard for lidar data. A LAS file contains point records in one of the point data record formats defined by the LAS specification. All point data records must be of the same format within the file. The various formats differ in the data fields available, such as GPS time, RGB and NIR color and wave packet information.
A related data structure to the point cloud are 3D meshes, where the 3D points have been converted into a vector model. Three points each form a surface. In computer graphics, mesh refers to a polygonal network for the geometric description of surfaces. This makes the data faster to visualize and easier to analyze.
### 3.2 Point Cloud Software
QGIS desktop is the leading open source geographic information system. Since QGIS 3.18 it is possible to open an .las or .laz file directly to view a point cloud in 2D or 3D. Currently, with QGIS you can not edit point cloud data.
QGIS supports the point cloud data formats LAS/LAZ and .EPT. In order to display PC data there are formats which are optimized for like Entwine Point Tile (EPT). If a data source is opened in LAS or LAZ format for the first time in QGIS, QGIS will convert it to COPC, adding a file with the extension "".copc." eg. file.copc.laz. This process can take a few minutes to build the index. But once the index is built, the point cloud file will load quickly.
CloudCompare is a program that can be used exclusively for point clouds and meshes. Accordingly, numerous data formats are supported. CloudCompare offers many functions. For example, point clouds can be visualized, clipped, and referenced to each other.
MeshLab is a widely used open source software system for processing and editing meshes. It offers functions to convert point clouds into meshes and preparation for 3D printing.
## 4. Visualizing Point Cloud Data in QGIS
If we want to visualize Point Cloud data the following steps should be considered:
1. Add Point Cloud data to QGIS project
1. View Point Cloud data in 2D
1. 2D symbology for QGIS 3D canvas
1. Prepare Point Cloud data for QGIS 3D canvas
1. Create 3D canvas in QGIS
**1. Add Point Cloud data to QGIS project**
To open a .laz or .las file just drag and drop the file into your project or open it by right-click. QGIS will automatically show a 2D view of the the point cloud.
On the left-hand side of the QGIS GUI the user can see the different layers displayed.
:::info
*NOTE*: CRS must be in planar system like Web Mercator, i.e. not in WGS84 lat/lon.
:::
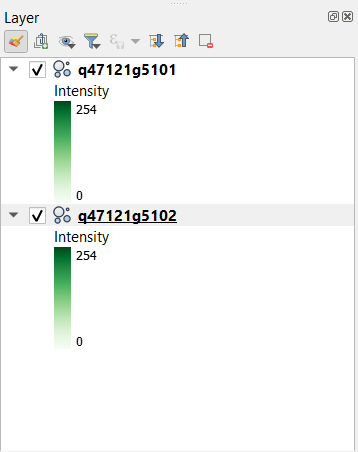
*Figure: Layers of QGIS Project*
**2. View Point Cloud data in 2D**
QGIS 3.18+ will automatically generate a 2D view of a point cloud when it is added to the canvas. Not all point clouds are created equally, so the initial appearance may vary based what attributes are contained within the point cloud data.
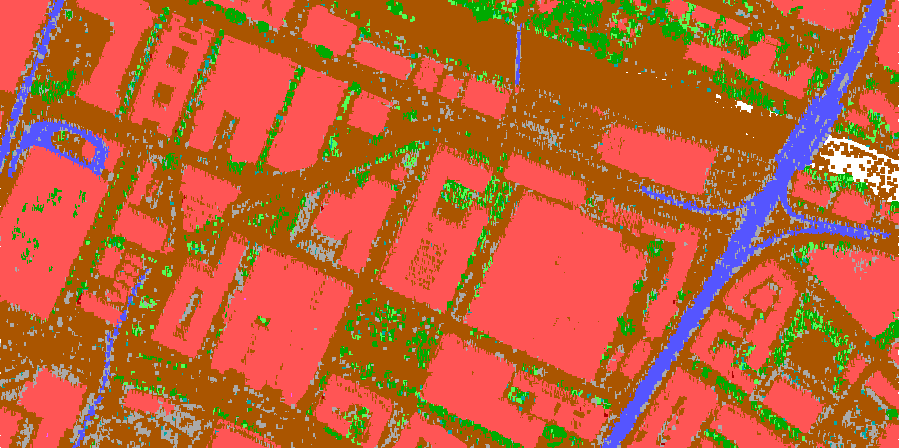
*Figure: 2D Point Cloud Visualization in QGIS*
**3. 2D symbology for 3D Canvas**
2D symbology must be taken into account when designing a layout for a 3D canvas that will display a point cloud. The 2D and 3D aspects of a point cloud can tend to conflict with one another on a 3D canvas in QGIS. The 2D version of the point cloud will appear on a flat plane and can interrupt the view of the 3D point cloud which is usually on an uneven plane and can have gaps in the point cloud allowing for the 2D plane to become visible. The best advice here is to keep the view simple and set the 2D symbology or rendering to completely transparent or display only the bounding rectangle.
The images below highlight why it is important to remove or limit the 2D symbology when viewing the point cloud in 3D.
**4. Prepare Point Cloud data for 3D Canvas**
By clicking on the layer-editing-symbol ("Layergestaltungsfenster"), the user can open a window for different visualization settings. There is a possibility to choose between different settings such as RGB, Classification ("Klassifikation") or by Attribute ("Attribute nach Verlauf").
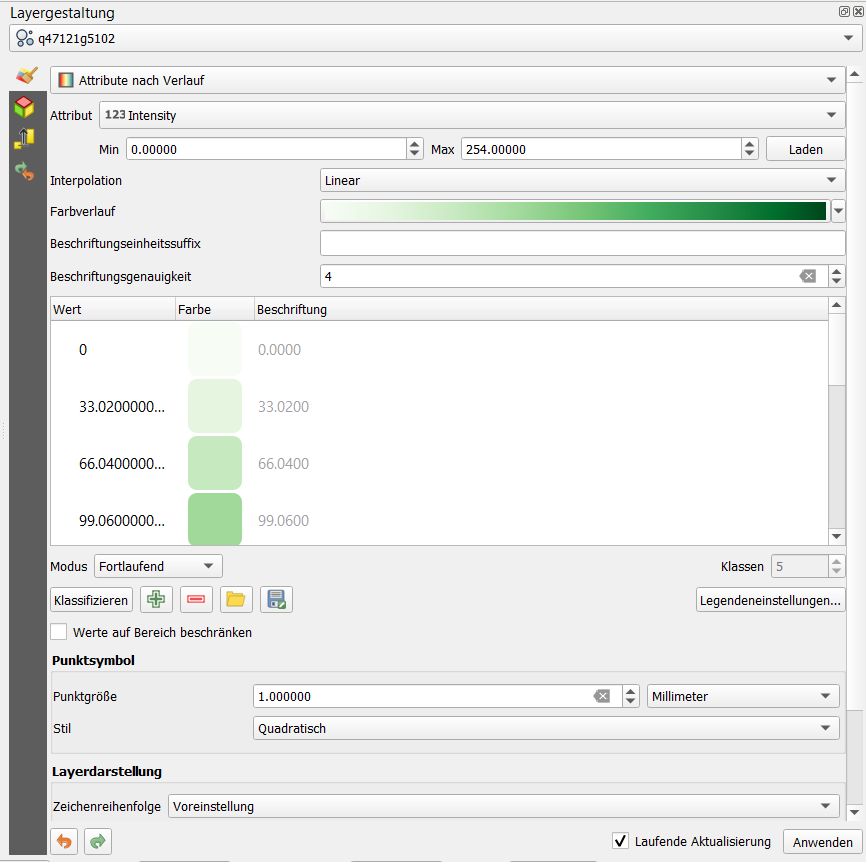
*Figure: Editing panel layers ("Layergestaltung")*
The user can choose his or her preference, depending on the object which will be visualized.
**5. Create 3D Canvas**
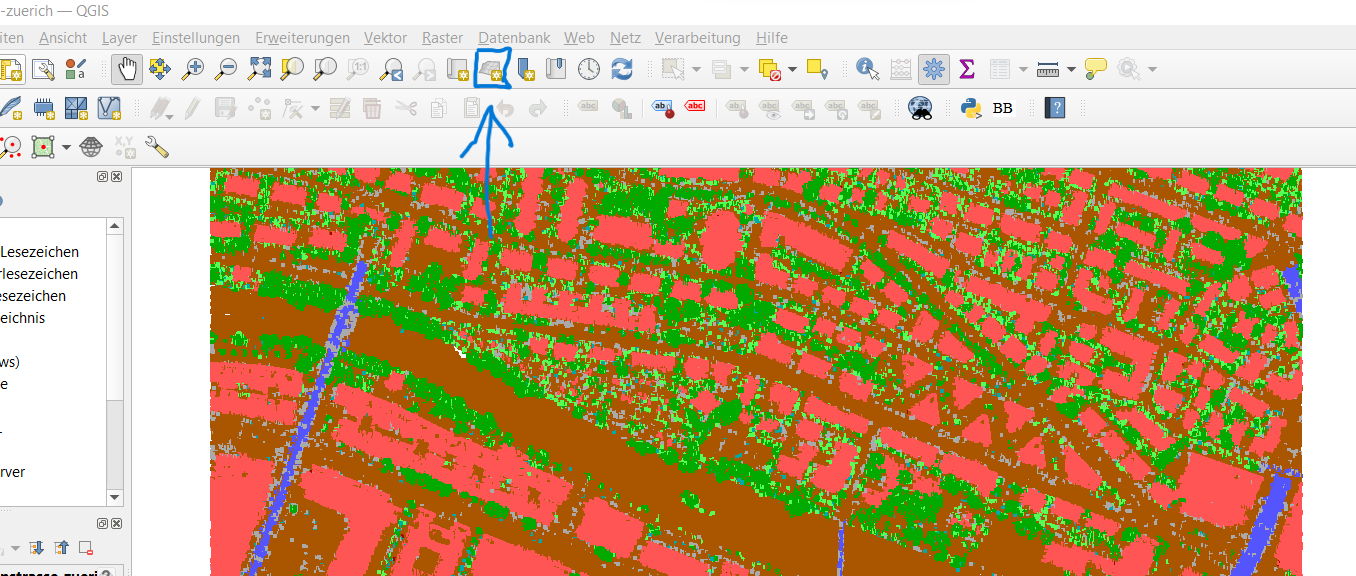
*Figure: 3D View QGIS*
By clicking on the button shown the user can access the 3D model. An exapmle can be found below. As an alternative select New 3D Map View ("3D Kartenansicht") in "View".
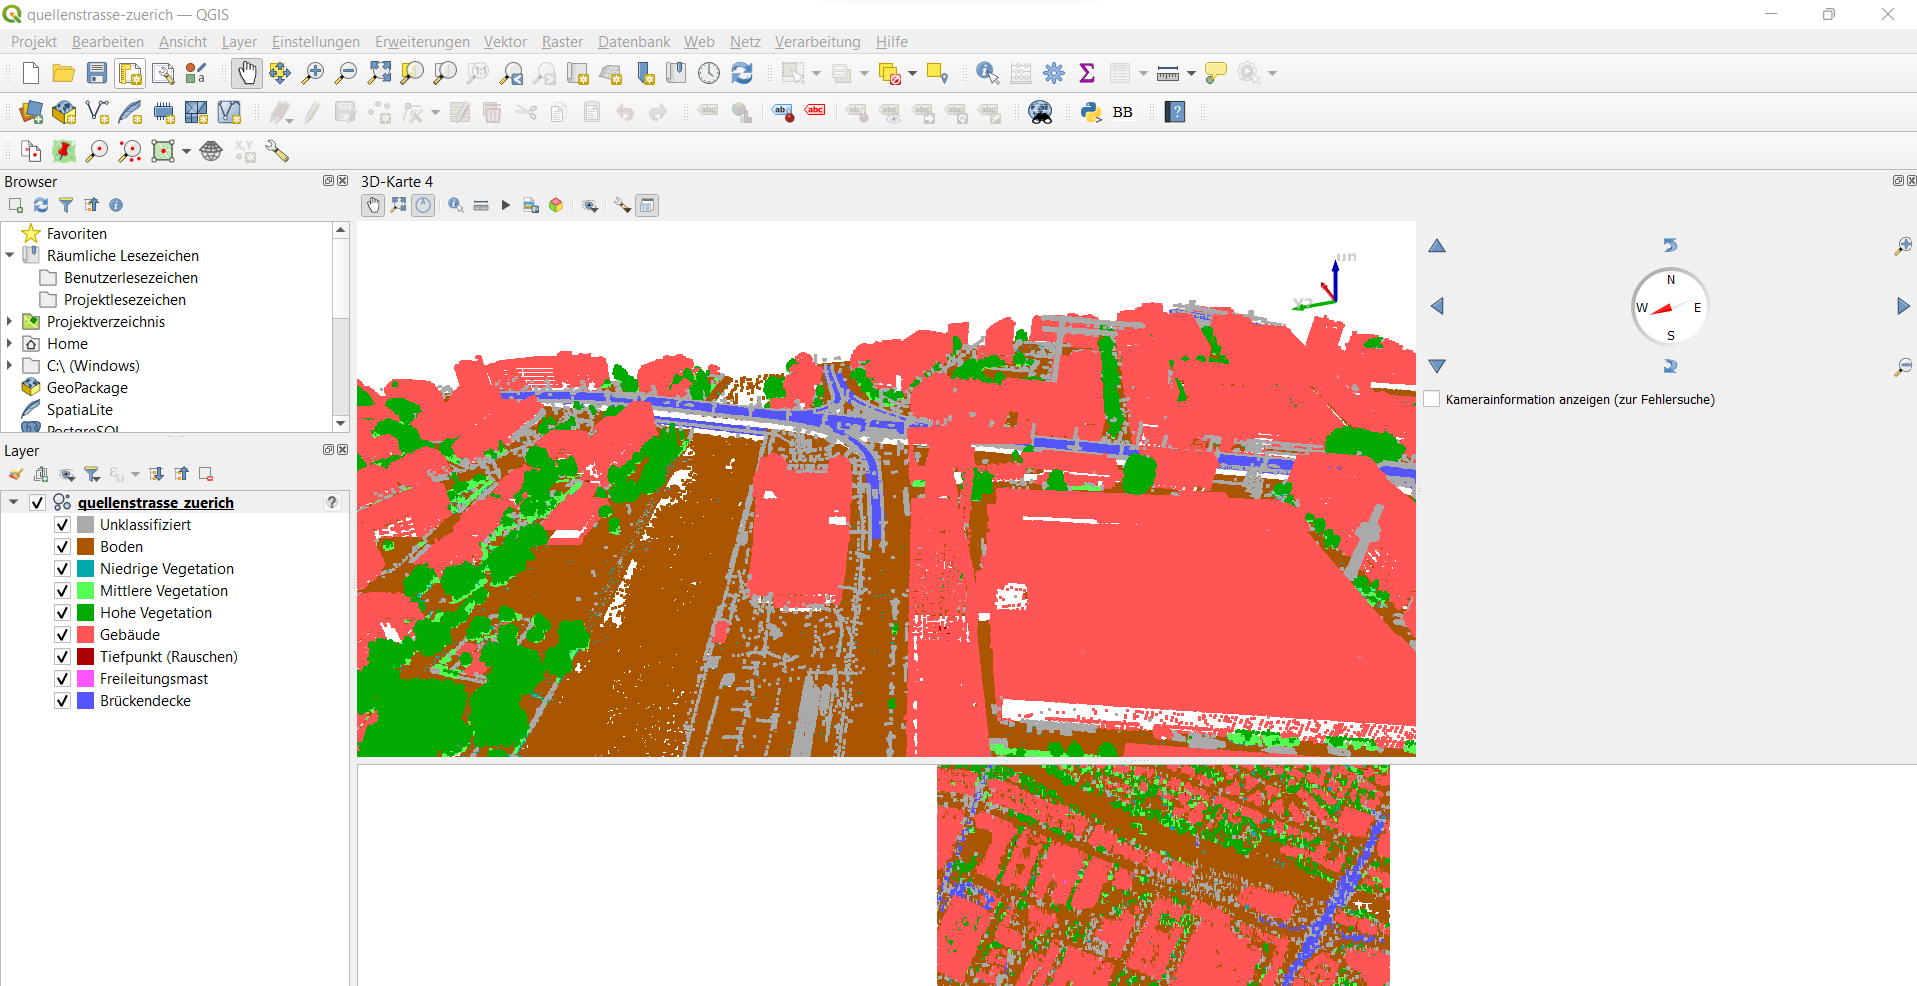
*Figure: Point Cloud Visualization Limmatplatz Zuerich*
:::warning
*NOTE*: Depending on the given data and the initial view, it is sometimes difficult to find an appropriate 3D perspective. With some experience using the QGIS GUI you will find a way!
:::
## 5. Measuring Point Cloud Data
Another useful feature of the 3D point cloud animation is that one can measure the real distance of buildings, streets or any different infrastructure. Open the 3D map and check the feature bar. There is a symbol to measure (ruler icon, ("Masslinie")). By clicking on it you can choose your desired unit of measurement.
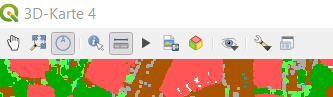
*Figure: Feature Bar 3D map*
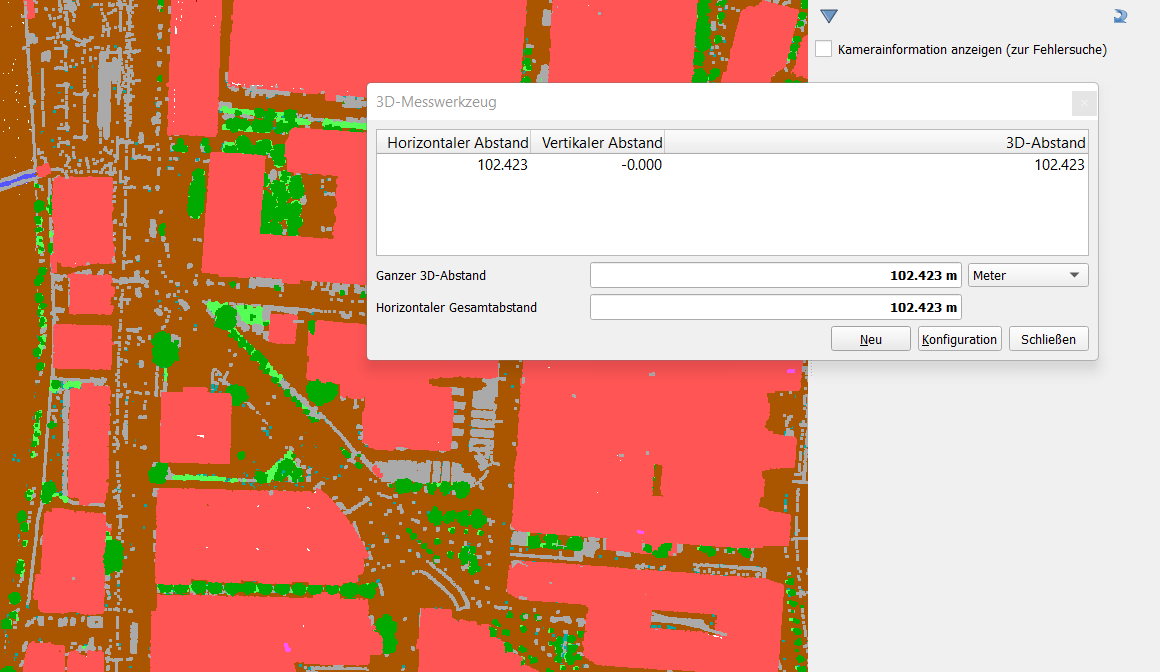
*Figure: Choose unit of measurement and measure distance*
Focus on your desired object, which you would like to measure and by just clicking on two points you will get the distance between these two points (horizontal and vertical)
## 6. Clipping of Point Cloud Data with QGIS
If you want to clip a certain section out of your original Point Cloud you can use the Layer Export function. Right click on the layer, navigate to "Export ("Exportieren")" and choose "Save as ("Speichern als")". The following window will appear:
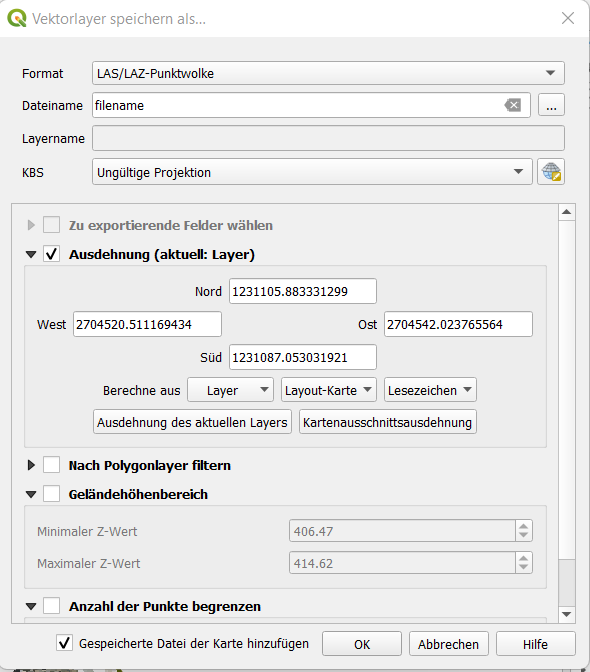
*Figure: Save Vector as...*
Selct "LAS/LAZ-Point Cloud (LAS/LAZ-Punktwolke)", choose a name for your file and click on "Extent ("Ausdehnung")". The four parameters west, north, east and south will mark the borders of your clipping. You get these coordinates via the bounding-box-tool (bbox). With cursor choose the clipping you would like to extract and click "Get BBOX". It will return the according coordinates. Check the illustration below.
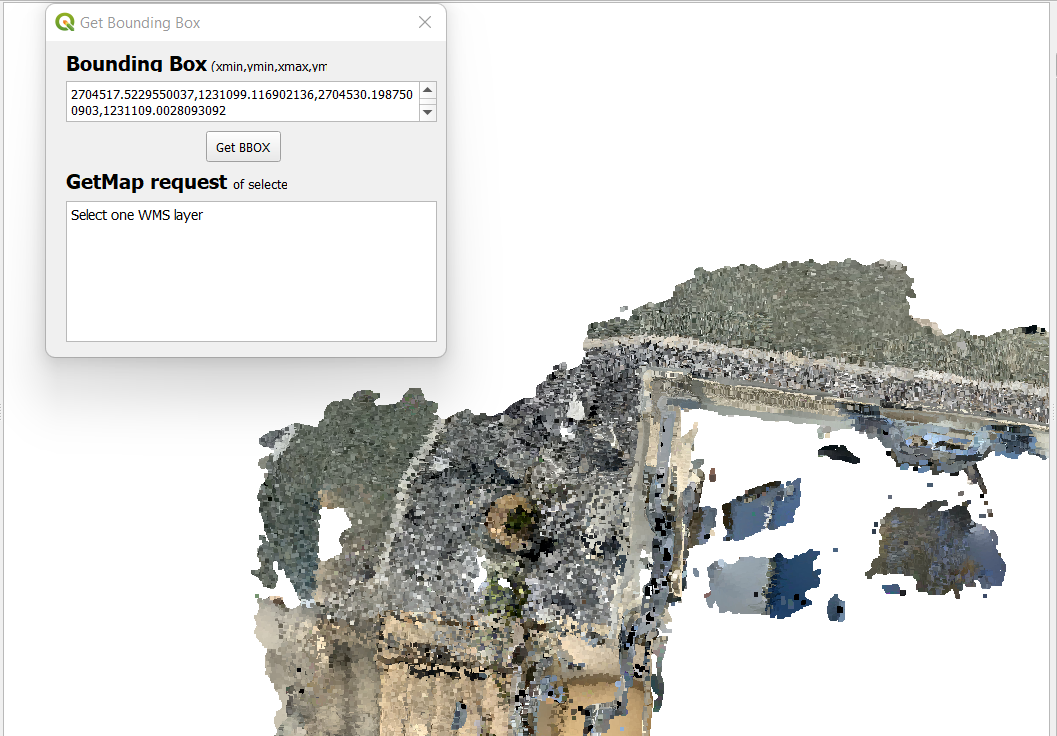
*Figure: Bounding Box Tool*
After choosing and inserting the coordinate borders, click "OK" and it will save your layer. The result in 3D can be be compared to one in the section of the example.
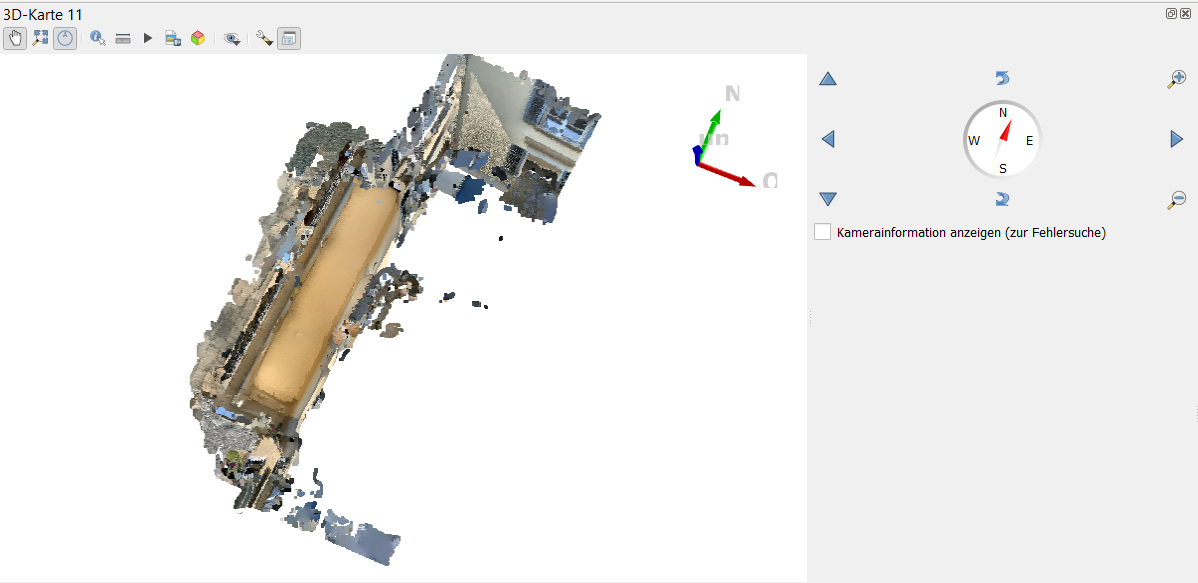
*Figure: Clipping of villa from above*
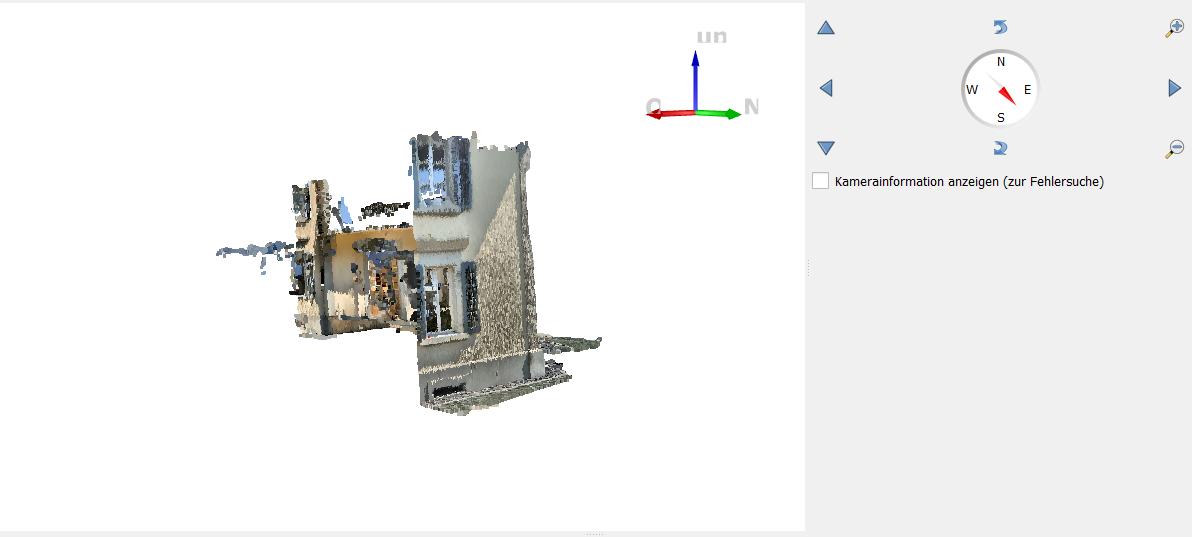
*Figure: Clipping of villa from the side*
While dealing with Point Cloud data you might face some challenges from time to time.
## 7. Outlook and Further Sources
This document covered the visualizing, measuring and clipping of point cloud data with QGIS. The management of Point cloud data is a novel feature of QGIS. It will mature over time and new functions will be added in future releases.
Further sources about Point Cloud data in QGIS are:
* https://www.pointsnorthgis.ca/blog/viewing-point-clouds-qgis/
* https://www.lutraconsulting.co.uk/blog/2021/04/06/qgis-pointcloud-tips/
If you look for more sample point cloud data here are some tips:
* [Geoslam](https://geoslam.com/)
* [gisgeography: Top 6 Free LiDAR Data Sources](https://gisgeography.com/top-6-free-lidar-data-sources/)
* [SketchUp](https://help.sketchup.com/en/scan-essentials-sketchup/sample-point-cloud-data)
---
This educational material is free to use under license (c) [CC0 1.0](http://creativecommons.org/publicdomain/zero/1.0/) unless noted otherwise.